
 |
|
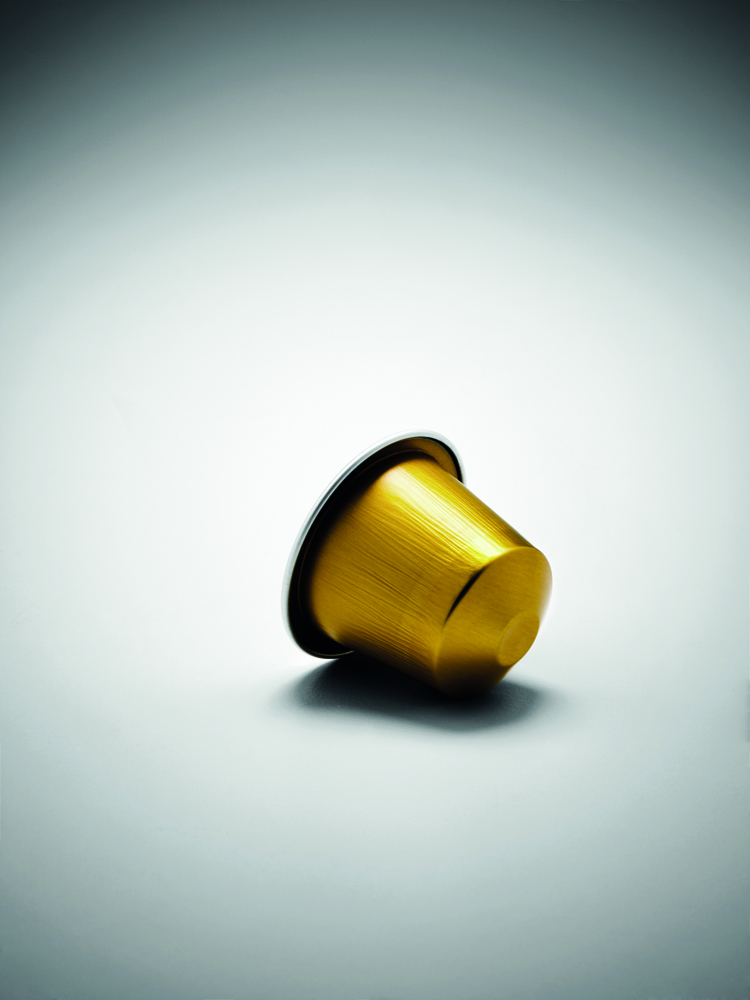
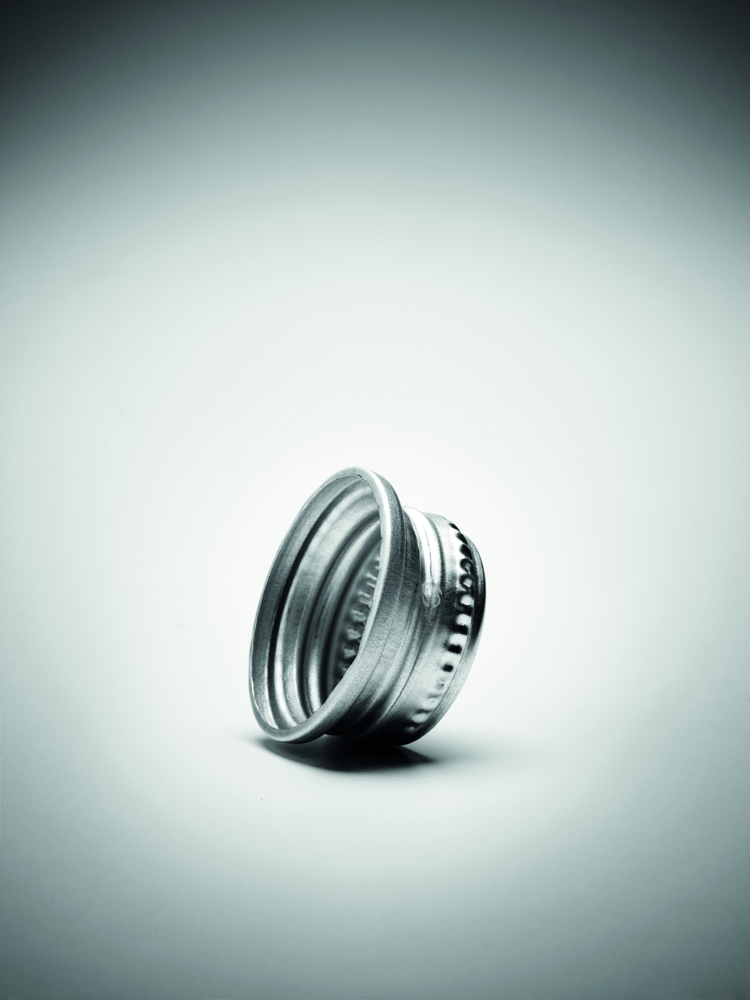
This issue’s black and white still-life photographs by Sergio Tornaghi
|
Global Context
Global Aluminium Flows
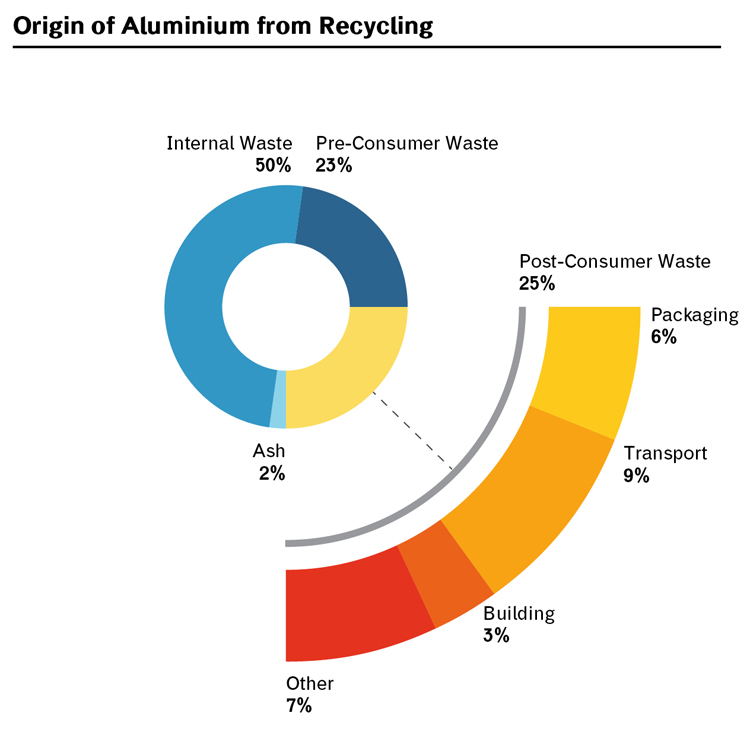
75% of aluminium produced over the last 125 years is still in use. 52% of aluminium comes from recycling, 26% from post-consumer matter.
Endless recyclability, versatility, lightness and high conductivity are some of aluminium’s peculiarities, a material present in nearly all aspects of our everyday lives and in many industrial sectors.
There are aluminium components in many everyday objects: bicycles, cars, aircrafts and trains, doors and windows. We are also surrounded by aluminium in our houses: cans, aerosols, tubes, trays and rolls, pots, cutlery, coffee makers and various accessories, let alone packaging.
Suffice it to say that, in 2013, the world production of aluminium exceeded 100 million tonnes, of which 60 million were finished products.
Besides being a material with a wealth of excellent features, aluminium boasts a high recycling rate. As a matter of fact, nowadays, 1/3 of all finished products in use are substitutes and 2/3 are new. Aluminium products have indeed a long life cycle: about 75% of primary aluminium produced over the last 125 years is still in use.
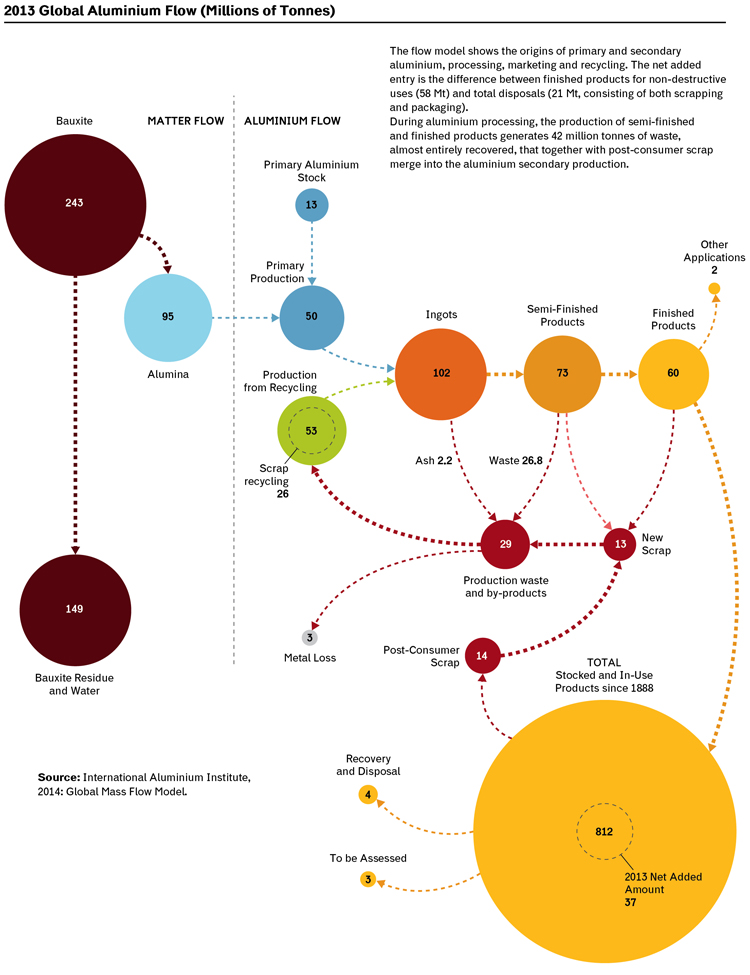
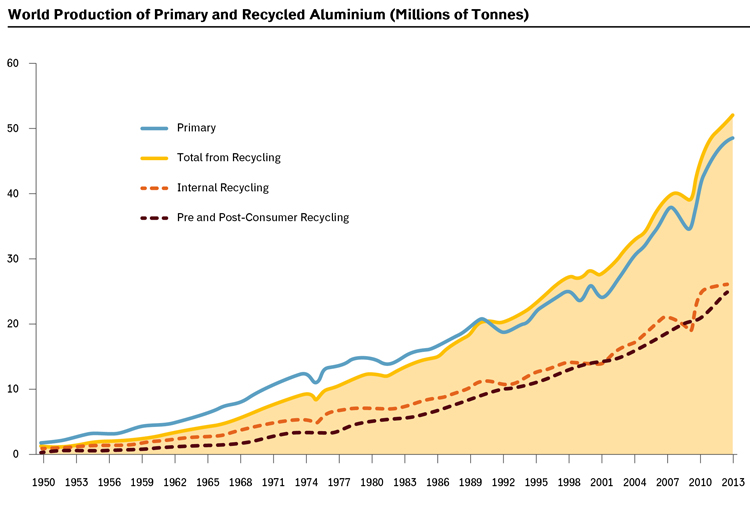
There are two production methods to obtain aluminium: from primary processes (48%) and from secondary processes (52%), namely from recycling.
Primary processes are based on the extraction of alumina from bauxite and the subsequent electrolysis, through which metallic aluminium is obtained. In 2013, to produce 50 million tonnes of primary aluminium, 243 million tonnes of bauxite were extracted producing 95 million tonnes of alumina.
Secondary processes, from which 53 million tonnes of aluminium are derived, have been fed by 56 million tonnes of processing waste and pre and post-consumer scrap. In particular, 2/3 of post-consumer aluminium waste are directly recycled, generating 26% of secondary production.
Aluminium Production
Strong production growth, above all of secondary and recycled aluminium.
Over the last 50 years, the production of primary aluminium has increased tenfold and has grown by 60% in the last 10. Currently, it is concentrated in China (over 50%), while in Europe it is dwindling (15%).
Moreover, the production of secondary aluminium from internal recycling, based on remelting of internal processing and production waste (unmarketed) of semi-finished products, has also skyrocketed over the last fifty years, reaching 27 million tonnes.
Also, the production of secondary aluminium from pre and post-consumer recycling, based on refining and remelting both of pre-consumer processing and production scrap (commercial) of finished products and post-consumer waste must be taken into account: it amounts to about 26 million tonnes, of which about half from post-consumer activities. It is the fastest growing production segment, which increased twenty times over the last 50 years and over 60% in the last ten. In China, the production from recycling is low, while that from post-consumer materials is concentrated mainly in Europe and Japan.
Recycled post-consumer materials mainly derive from car and means of transport scrapping and packaging collection.
End Uses of Aluminium
The variety of uses: transport, building, packaging, electric sector, consumer goods.
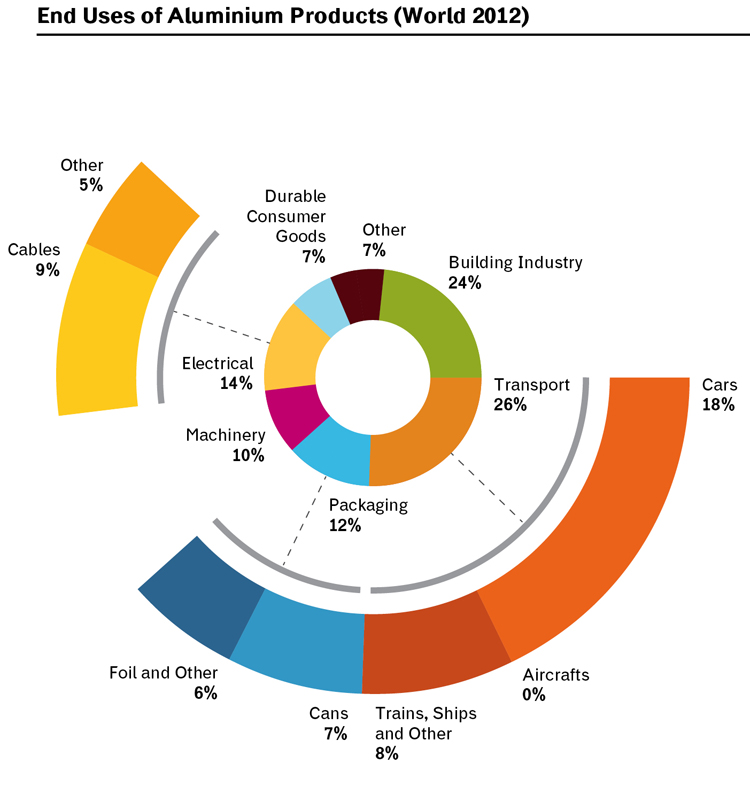
Aluminium has a plethora of uses, but on a global scale it is mainly used for means of transport (mainly cars and trains) and in the construction industry.
Other important areas of use are the electric sector (mainly cables), packaging production, mechanical manufacturing and durable goods (from pots and pans to furniture).
All these sectors have expanded their production volume, with regional differences. In China, for example, the construction and electric industries have experienced an increase in aluminium use, whilst in Europe aluminium use has soared in the transport business, despite the car market crisis, while the production for the building sector has stabilized.
Durability of Aluminium
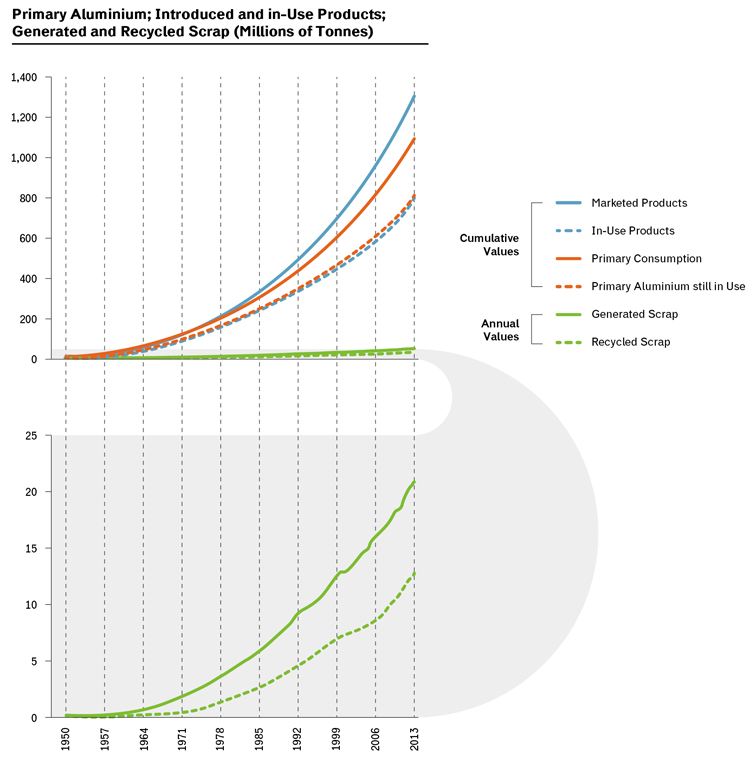
65% of aluminium products marketed since 1950 is still in use. 75% of the aluminium produced is still employed.
About 65% of all aluminium products marketed since 1950 is still in use today. This is the effect of the products’ long service life. But consumption has also soared considerably: little less than 40% of all aluminium products after World War II has been introduced just over the last ten years.
Products’ longevity, together with a high recycling rate, has determined a strong persistence of primary aluminium produced since 1950 (over a total of 1.4), about 75% is still used – directly or after recycling – in products which are still in use.
Average LIfe of Aluminium Products
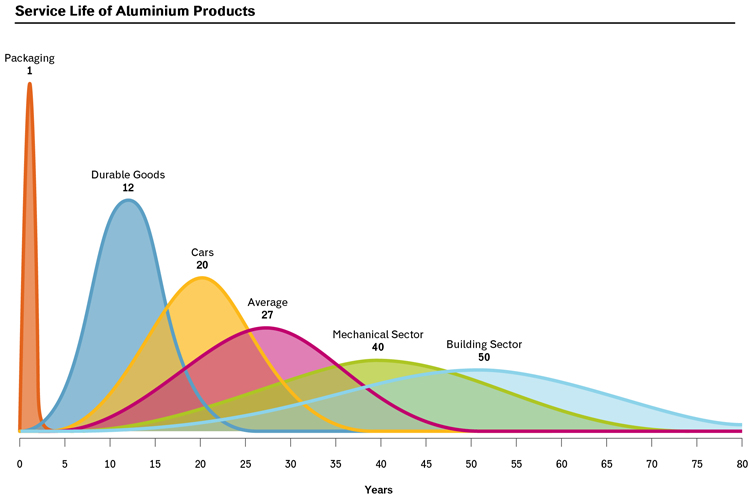
As mentioned before, most aluminium products, in particular those for the construction and mechanical industries, have a long life expectancy. Calculated on the 2013 production, the average life is 27 years. This means that, except for packaging, the availability of scrap enjoys a long time gap compared to production.
Source: Elaboration on International Aluminium Institute Data.
Taking into consideration all products placed on the market, the share of aluminium from recycling amounts to about 23%.
But, despite the high value of aluminium and its recyclability, a significant share of aluminium is still wasted. According to some figures, since 1950 to date, about 50% of scrap, theoretically generated, is not recycled.
Currently, the collection and recycling rate of manufacturing waste exceeds 90%, while the collection and recycling of old scrap amounts to about 60% on a global scale (about 70% in Europe).
The Italian Context
The Italian Aluminium Flows
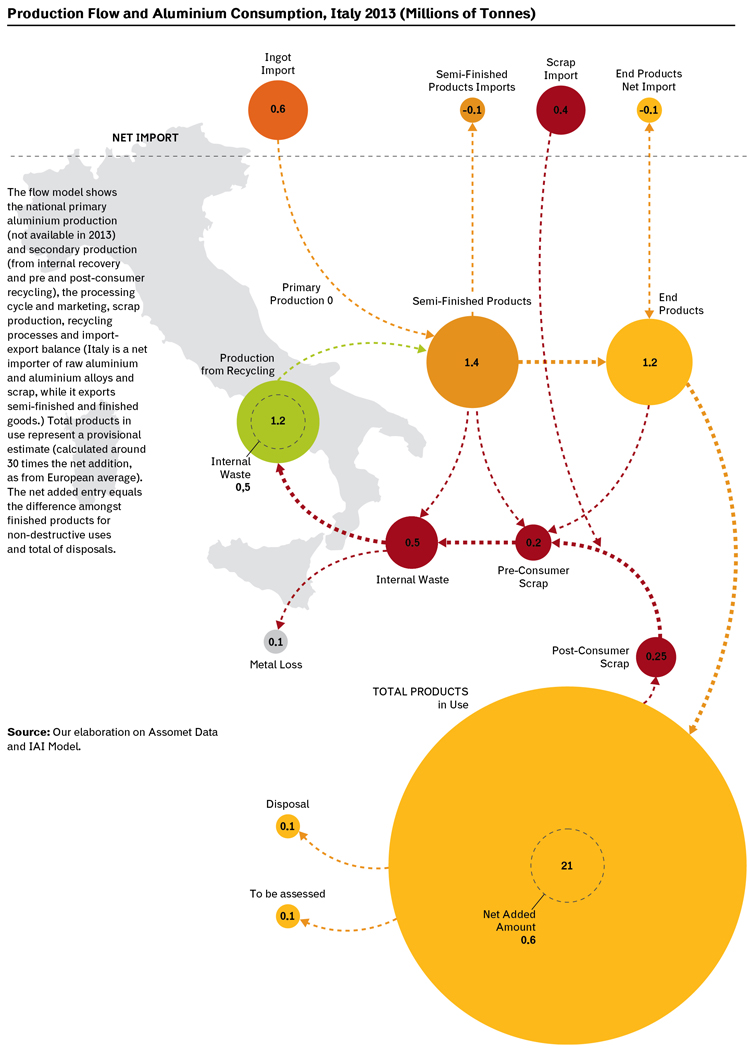
Italy is Europe’s second largest producer, with a 100% production from recycling.
In Italy, the production of primary aluminium stopped in 2013. Basically, we only produce secondary aluminium, from recycling, derived both from internal recovery (waste from rolling and extrusion processing integrated with remelting plants), and pre-consumer (from industrial processes) and post-consumer fractions (scrapping of means of transport, building demolitions, waste from consumer goods and packaging).
Overall, in Italy, the aluminium production is fuelled by over 1.3 million tonnes of internal waste and scrap, and a substantial share of scrap is imported. Remelting plants produce 487,500 tonnes of alloys in shapes (rolled items and billets) for rolling and extrusion; the refining plants, 663,700 tonnes of alloys in slabs for foundries and deoxidising products for steel mills. Companies manufacturing semi-finished items import about 640,000 tonnes of raw aluminium and produce 789,000 tonnes of semi-finished products for extrusion and rolling and 625,000 tonnes of castings for foundries.
After all disposals, the yearly aluminium flow amount to 700,000 tonnes, with a total of 20 million tonnes of products in use.
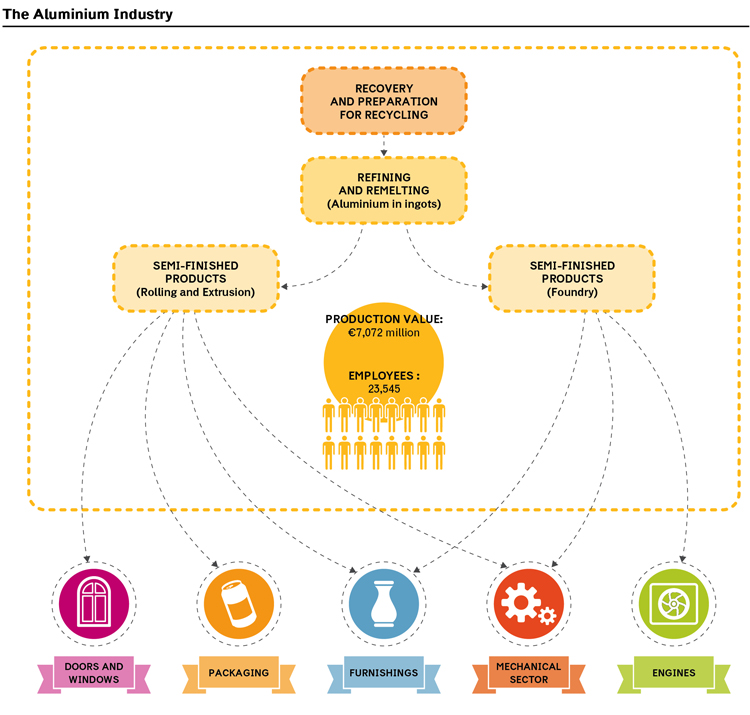
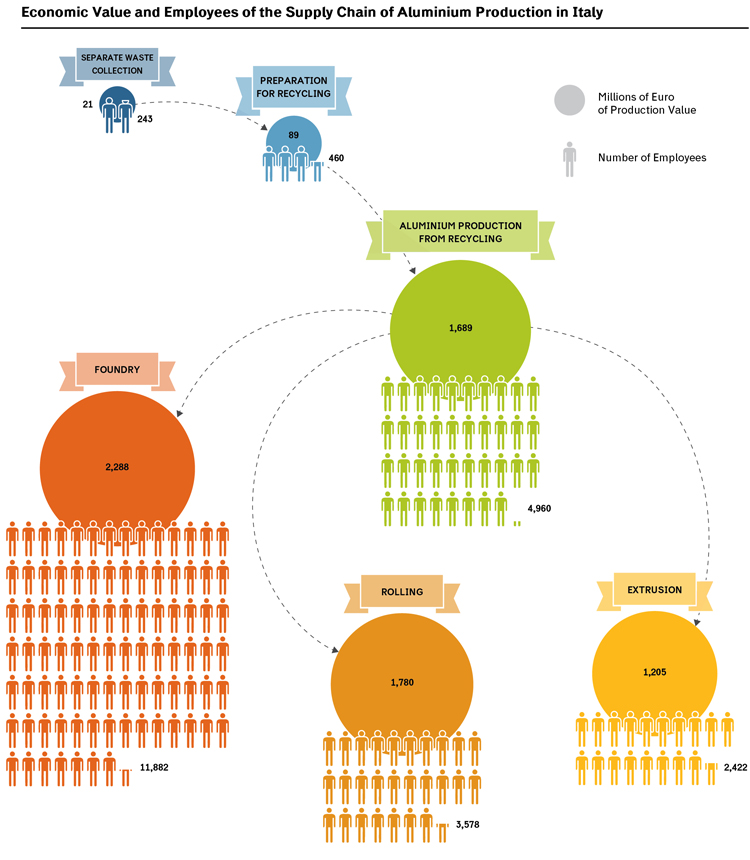
The Industrial Supply Chain of Aluminium
The industrial supply chain of aluminium consists of:
- scrap recovery (separate waste collection, marketing, preparation for recycling, first and foremost to post-consumer national scrap);
- refining and remelting for secondary aluminium production (billets, liquid, slabs and plates);
- production of plastic semi-finished products (extrusion, rolling and forging) – recorded in an integrated way with the refining and remelting industries – and the melting activities with the casting production;
- industrial activities employing aluminium semi-finished products (exclusively or as components for products) for processing and producing finished products in the construction, motor, transport, mechanical, furniture, packaging, electrical and electronic sectors.
The first three phases are covered by statistical assessments or can be reasonably estimated (as is the case with the first of the three phases).
Overall, in Italy, the aggregate production exceeds 7 billion euro, with 24,000 employees.
The use of aluminium in the various sectors of industrial processing is only sporadically recorded; therefore, a reliable estimate of the economic and occupational value of these activities is impossible.
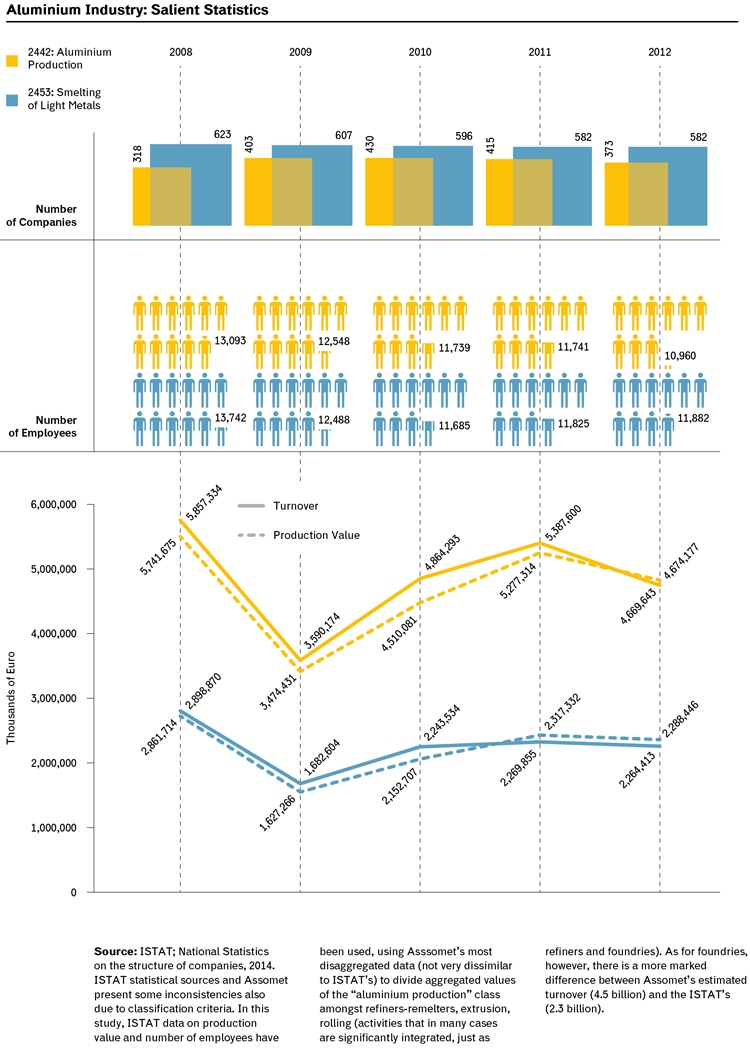
Relevant Sector Statistical Data
The industrial aluminium sector is characterized by the presence of a very limited number of medium enterprises – mainly refiners and remelters and integrated businesses in the supply chain – and by a wide number of small and medium enterprises, mainly dealing with smelting.
According to Assomet data, within the “aluminium production” class, the remelting and refining businesses are 27 and represent 36% of the turnover and 40% of the category employees.
It has to be mentioned that recession caused a turnover and production value decrease accompanied by a substantial employment reduction associated with the closure of some important companies and some concentration phenomena.
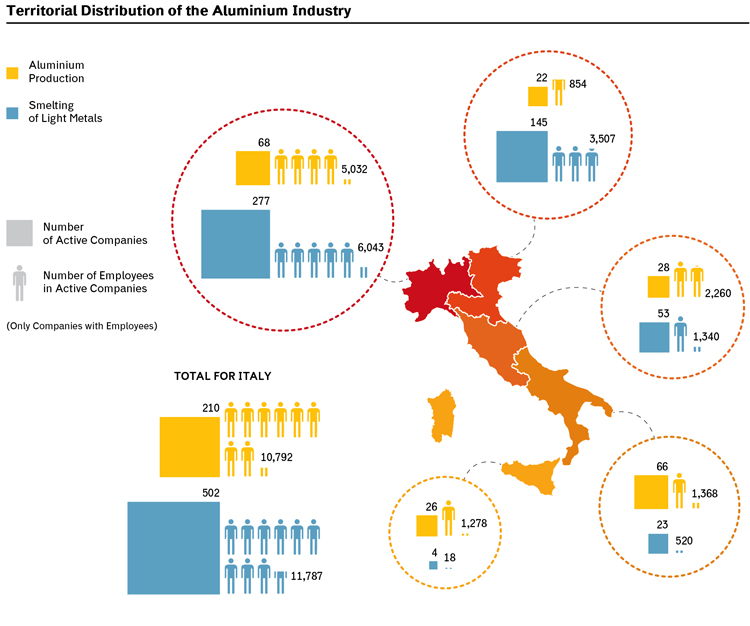
Territorial Distribution of the Aluminium Industry
While the primary aluminium industry production has strong location constraints associated with access to raw material, water availability and possibility of low cost energy supply, the secondary aluminium industry follows a distribution mainly linked to the integration with scrap suppliers and with industrial processing clients.
In Italy, there is a host of significant production hubs – in Lombardy, Piedmont, Veneto, Latium and Campania – with a wide distribution all over the country, in particular as far as smelting is concerned.
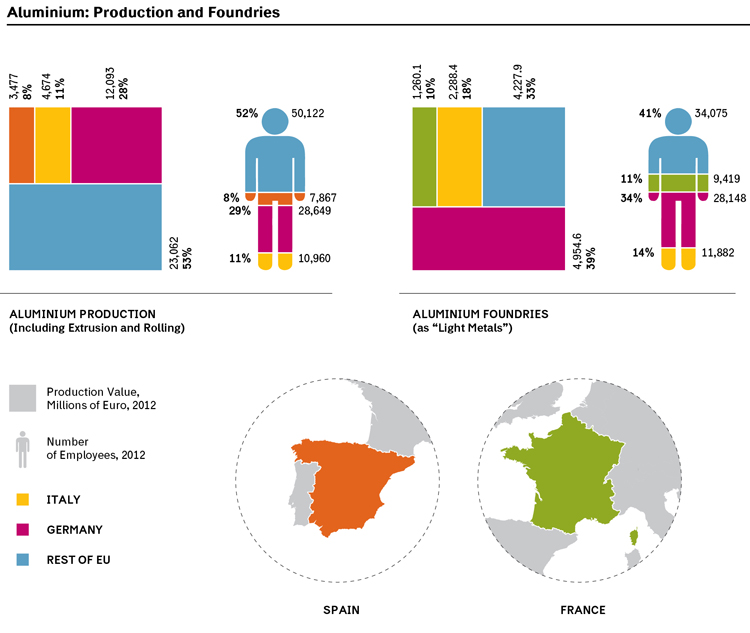
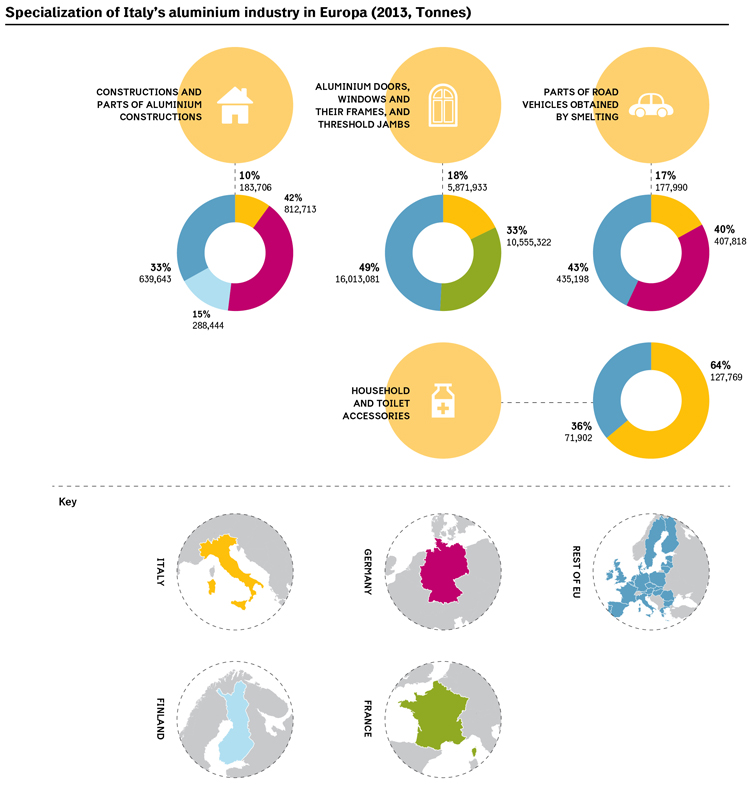
Italian Aluminium Industry in a European Context
The Italian aluminium industry is the second in Europe, behind Germany, both in the aluminium and in the semi-finished production, with a strong production of melting and castings production (a distinctive feature of the secondary aluminium industry).
Overall, the Italian industry represents 14% of Europe’s turnover and 13% of total employment.
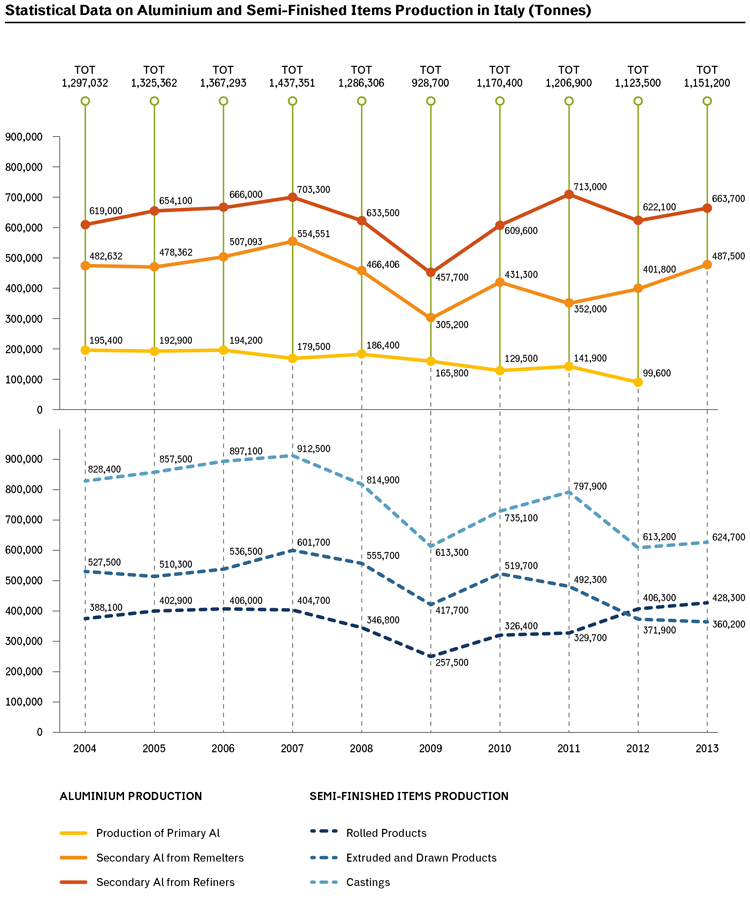
National Production of Aluminium and Semi-Finished Products
Italy – EU’s second aluminium producer after Germany and third in Europe after Norway and Germany – is the first secondary aluminium producer.
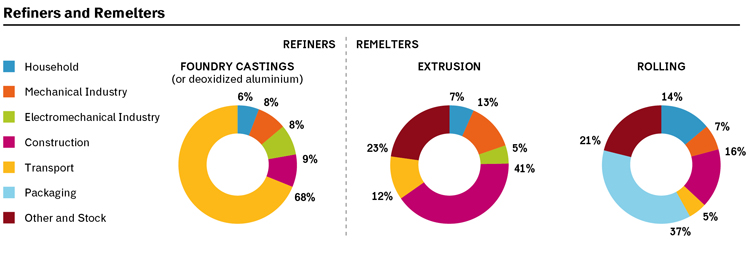
44% of the national production is represented by foundry castings, 30% by rolled products and 26% by extruded and drawn items.
Historically Italian production has always been based on scrap, but since 2013 it has only come from secondary aluminium production: over a total of 1.15 million tonnes of aluminium ingots produced, 42% was secondary aluminium from remelters and 58% secondary aluminium from refiners (with a high component of post-consumer material).
From the 2009 crisis, total production has picked up, although still lower compared to pre-crisis peaks, in particular the production of rolled sheets and castings is still affected by the negative cycle of the construction and car industries.
The production of semi-finished items, based also on primary aluminium imports, is slightly over 1.4 million tonnes.
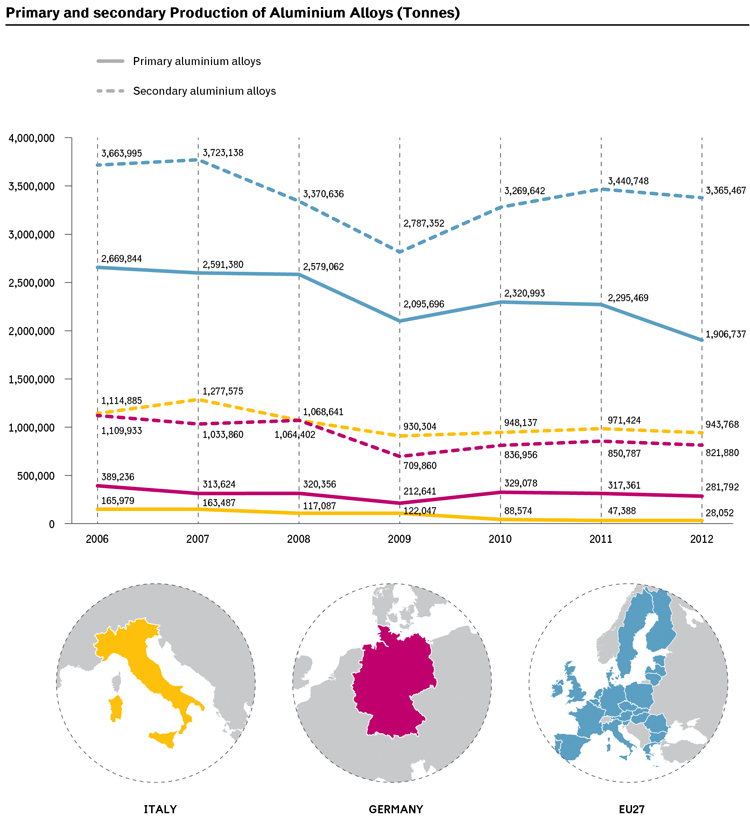
Primary and Recycled Aluminium Production in Europe
At EU level, primary aluminium production represents slightly over one third of total production.
The leading primary producer in the EU is Germany (outside the EU, in Europe, it is Norway).
Secondary aluminium production, namely from scrap recycling (internal, pre and post-consumer items) is highly concentrated in Germany and Italy, which over the last few years has established its leading position as secondary aluminium producer in the Union.
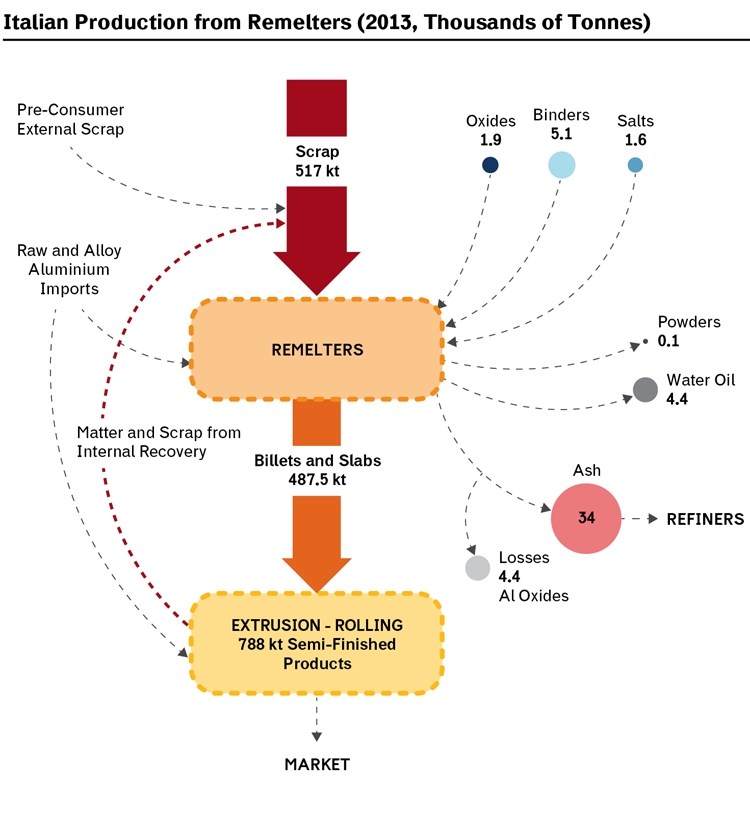
Italian Aluminium Production from Recycling: Remelters
Remelters process wrought alloy scrap to obtain new wrought alloys: national production is 487,500 tonnes (2013 data).
Net demand – excluding binders – of remelters amounts to 106% of the production of billets, slabs and continuous casting liquid. Scrap feeding remelters are mainly made of internal waste (rolled and extruded products in integrated plants) and pre-consumer scrap. Losses in processing (such as oxidized aluminium) are lower than 1%.
Remelters’ main products are:
- extrusion billets (50 to 500 mm-diameter cylinders, up to 7 metres long) for the production of sections, tubes and rods;
- rolled sheets for the production of foil (up to 5 micron per foil).
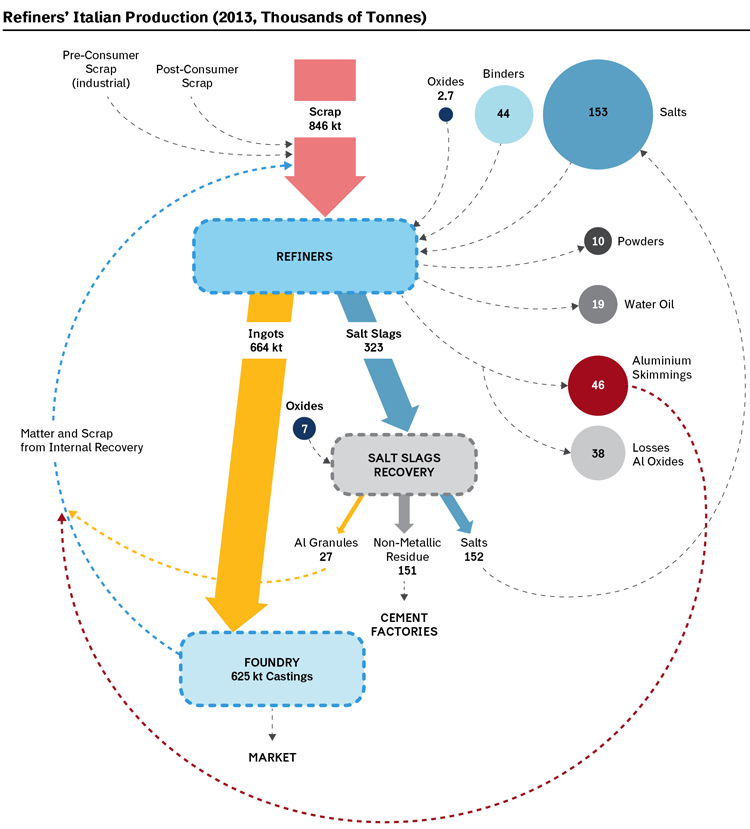
Italian Aluminium Production from Recycling: Refiners
Refiners process pre and post-consumer scrap for the production of foundry alloys and deoxidized aluminium used in the steel industry.
Refiners’ national production is 664,000 tonnes (2013 data).
Refiners’ net demand amounts to 127.5% of castings production. Scrap feeding refiners derive from pre-consumer contents of semi-finished and manufactured products, from remelters’ ashes, from salt waste recovery and post-consumer scrap from demolition and packaging.
Due to the lower level of purity of incoming alloys, the processing requires higher quantities of salts and binders and generates more losses, about 6%.
Refiners’ main products are:
- foundry ingots, for castings production;
- aluminium for deoxidation in steel plants.
Consumption of Scrap and Internal Waste
Secondary aluminium production is fed by three types of scrap.
1) Post-consumer waste, made of old scrap – even mixed with other substances (paints, other materials) – deriving from dismantling, disposals and separate waste collection of urban waste.
The estimate for 2013 of post-consumer scrap amounted to 400,000 tonnes (of which less than 70,000 from urban waste).
2) Pre-consumer waste (marketed), made of new and clean alloys and both from production processes of semi-finished products and manufacturing processes (turning, cuts and out of spec).
The 2013 estimate for pre-consumer scrap amounted to 475,000 tonnes.
3) Internal waste (not marketed) of production processes, made from the recovery of waste and salt solutions, ingot production waste, rolling and extrusion waste in integrated processes.
Such flows are not assessed in statistics and amount to 485,000 tonnes.
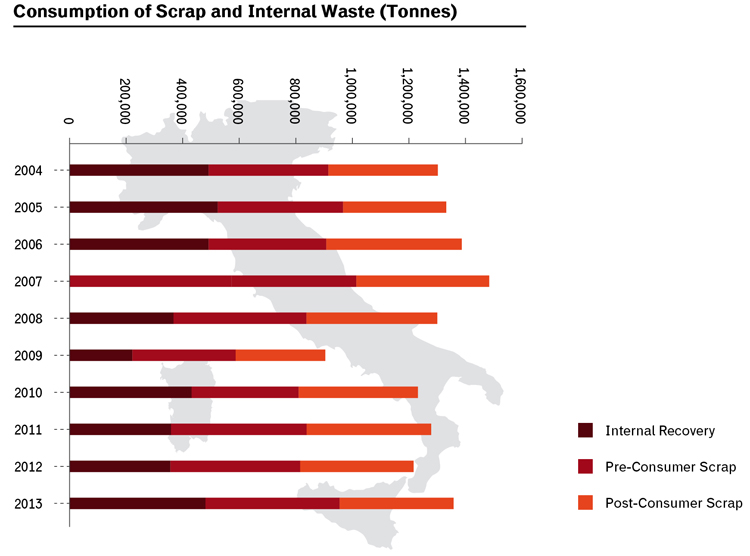
Internal Recovery and Pre-Consumer Scrap
By internal recovery we mean the recovery of production waste and non-marketed pre-consumer scrap (and therefore not included in statistics) occurring within the production cycle (such as the recovery of production slags or salt solution slags) or within the same downstream-integrated company, for example with extrusion or rolling. The most substantial recoveries are made of waste, turning and shavings from rolling or extrusion from foundries. Production waste varies according to the type of product, ranging from 20-30% of the end product.
Pre-consumer scrap is waste – marketed and therefore statistically relevant – of production and manufacturing processes. It is made of waste, turning and rolling, extrusion and foundry shavings (similar to those considered as “internal recovery”) and from production waste for the generation of sheets, extruded items and castings.
Post-consumer waste
According to historical consumption and substitution rates, generated post-consumer waste is estimated around 39% of new products placed on the global market and 51% of new products in Europe (data from International Aluminium Institute). In Italy, based on these values, a post-consumer production of scrap between 430 and 560,000 tonnes can be estimated (for 2013). The internal post-consumer collection for recycling is estimated at around 250-300,000 tonnes.
With the exception of packaging, post-consumer scrap is derived from products marketed on average 30 years ago.
The main sources of post-consumer scrap are:
- building demolition and renovation (doors and windows, facades) and demolition of infrastructure (pipes and piling);
- dismantling of vehicles (cylinder block and heads, pistons, brakes, wheels, heat exchangers) and means of transport (trains, underground);
- packaging (cans, trays, foil);
- electrical products (cables) and components of mechanical and thermal devices (radiators);
- waste from electrical and electronic devices (components from air conditioning devices, computers);
- durable consumer goods (furnishings, lighting and pots and pans).
Collection and recycling rates vary according to products, from less than 20% (for example for foil) to over 80% (building waste, cables).
Although aluminium is considered a precious metal, in many sectors waste generation rate is still very high (with considerable metal losses) between produced waste and collected waste from recycling.
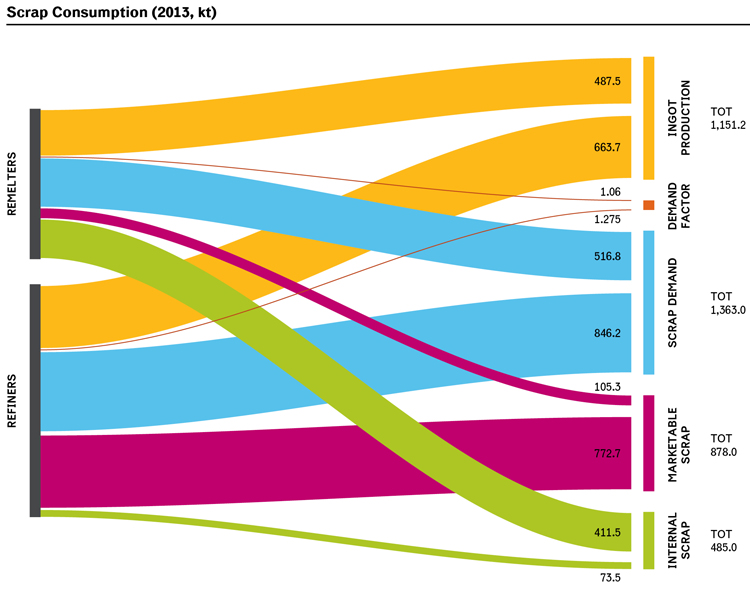
Methodology Notes on Scrap Consumption
Statistical data show only information about marketed scrap consumption, which includes all post-consumer scrap and part of pre-consumer scrap.
All internal waste recovered and recycled within the same production process and pre-consumer waste (mainly from rolling or extrusion) of downstream-integrated remelters is excluded, even in separate production sites.
The scrap consumption is based on data published by CiAl in its reports, just as the separation between pre-consumer and post-consumer scrap.
The consumption of internal waste is estimated on the difference between the theoretical demand of scrap (calculated as 1.06 per tonne of alloys from remelters and as 1.275 per tonne of alloys from refiners) and the consumption of marketed scrap. The resulting value is consistent with Global Model estimates by International Aluminium Institute (waste amounting to 34.3% of semi-finished products compared to 37% of Global Model). For refiners, the consumption of internal waste amounts to the recovery of waste and salt solutions.
The Recovery of Salt Slags
In the refining process, scrap melting occurs under a layer of salt, whose function is to protect molten aluminium from oxidation processes and absorbs non-metallic residues. Salt slags are recovered, generally within the refiners’ plant, separating salts (recycled in the process), aluminium granules, iron powders and non-metallic residues (recovered from cement factories).
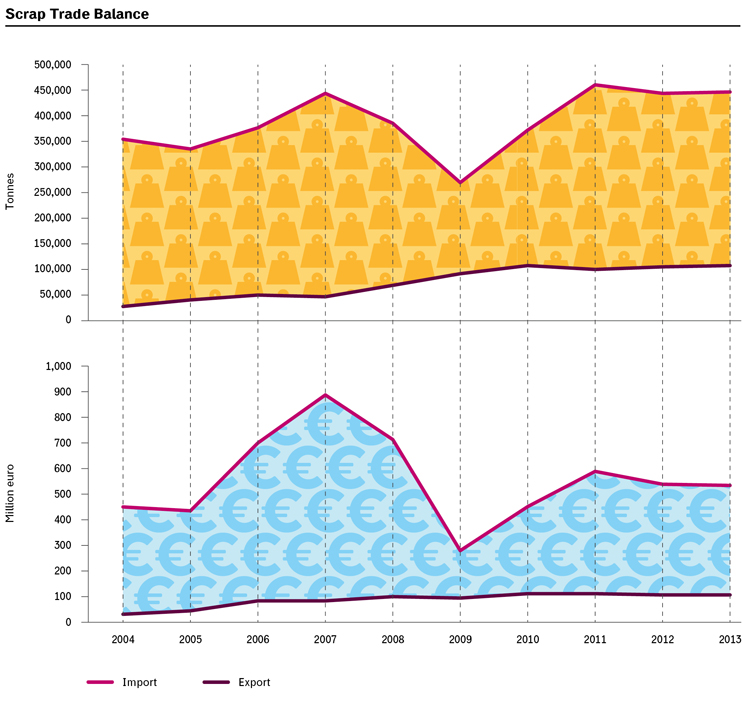
Scrap import-export
The Italian industry is a net importer of aluminium scrap: the historical peak was reached in 2011 with a value of 461,000 tonnes, whilst in 2012 and 2013 the values amounted to 445-450,000 tonnes.
Since 2009, the scrap aluminium exports have grown considerably (107,000 tonnes in 2013, as opposed to 67,000 in 2008): in 2013 our trade balance deficit was of 341,000 tonnes and €427 million.
Prices of aluminium scrap soared considerably between 2006 and 2008, with a significant reduction in 2009 followed by a recovery close to historical peaks in 2010 and 2011, keeping constantly high levels throughout the following years.
In 2013, the average value of scrap imports amounted to 1,192 euro/tonne (1,200 in 2012) while the average value of scrap imports was 1,000 euro/tonne (1,034 euro/tonne in 2012). Imports and exports mainly refer to pre-consumer scrap.
Prices of aluminium scrap from cans varied between 800 to 900 euro/tonne, while that from mixed non-selected scrap (one of the lower qualities of post-consumer collection) was estimated at around 150 euro/tonne.
Products from Recycling
End uses
The most extensive uses of aluminium production are in the engine design business and transport (mainly from foundry castings), in the construction sector (mainly extruded products), in the production of foil and packaging (sheets), in household and office products and in the mechanical sector.
Italy is the undisputed leader in the multifaceted field of the production of household items and toilet accessories. After Germany, it is the producer of automotive and transport components and is the leading country for some types of smelting products for engines and motor vehicles.
The Italian industry is also the largest in some building productions: for doors and windows it ranks only second for quantity, but first for turnover.
It is the second largest producer in Europe, after Germany, for foil stock.
Products: Doorsand Windows and otherUses in Building
The construction industry represents around 18% of the end uses of Italian production and 22% of end uses in Europe. Aluminium rolled and extruded products represent 77% of Italian production.
Aluminium is widely used in the construction sector: doors and windows, structural elements such as curtain walls, cover and ceiling sheets, bar sections or castings for air-conditioning or heating systems.
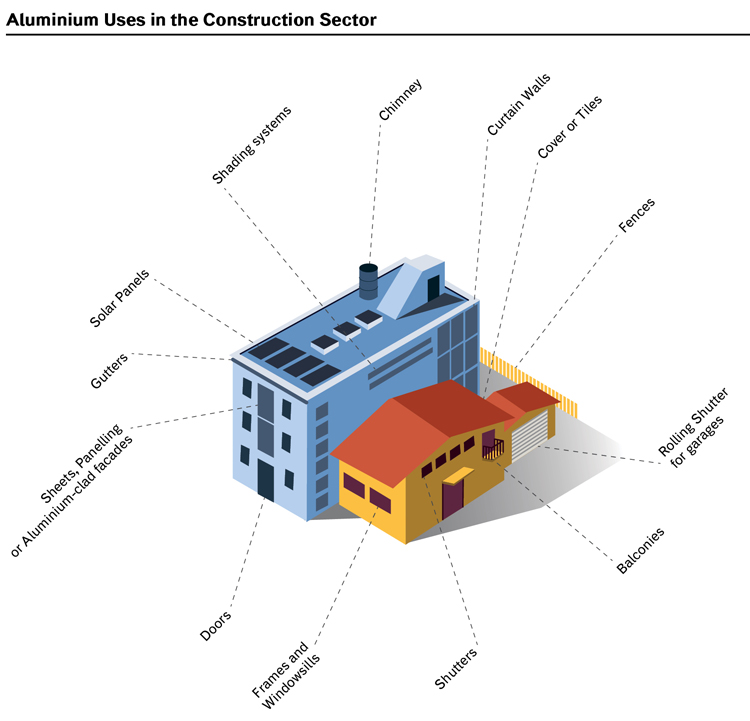
In these types of uses, lightness, corrosion, shock resistance and conductivity are particularly important.
One of the most significant industrial uses is for doors and windows, where aluminium covers 30% of the Italian market.
Uses in the building sector are long lasting – from 20 to 50 years depending on the various products – with a high recovery and recycling rate.
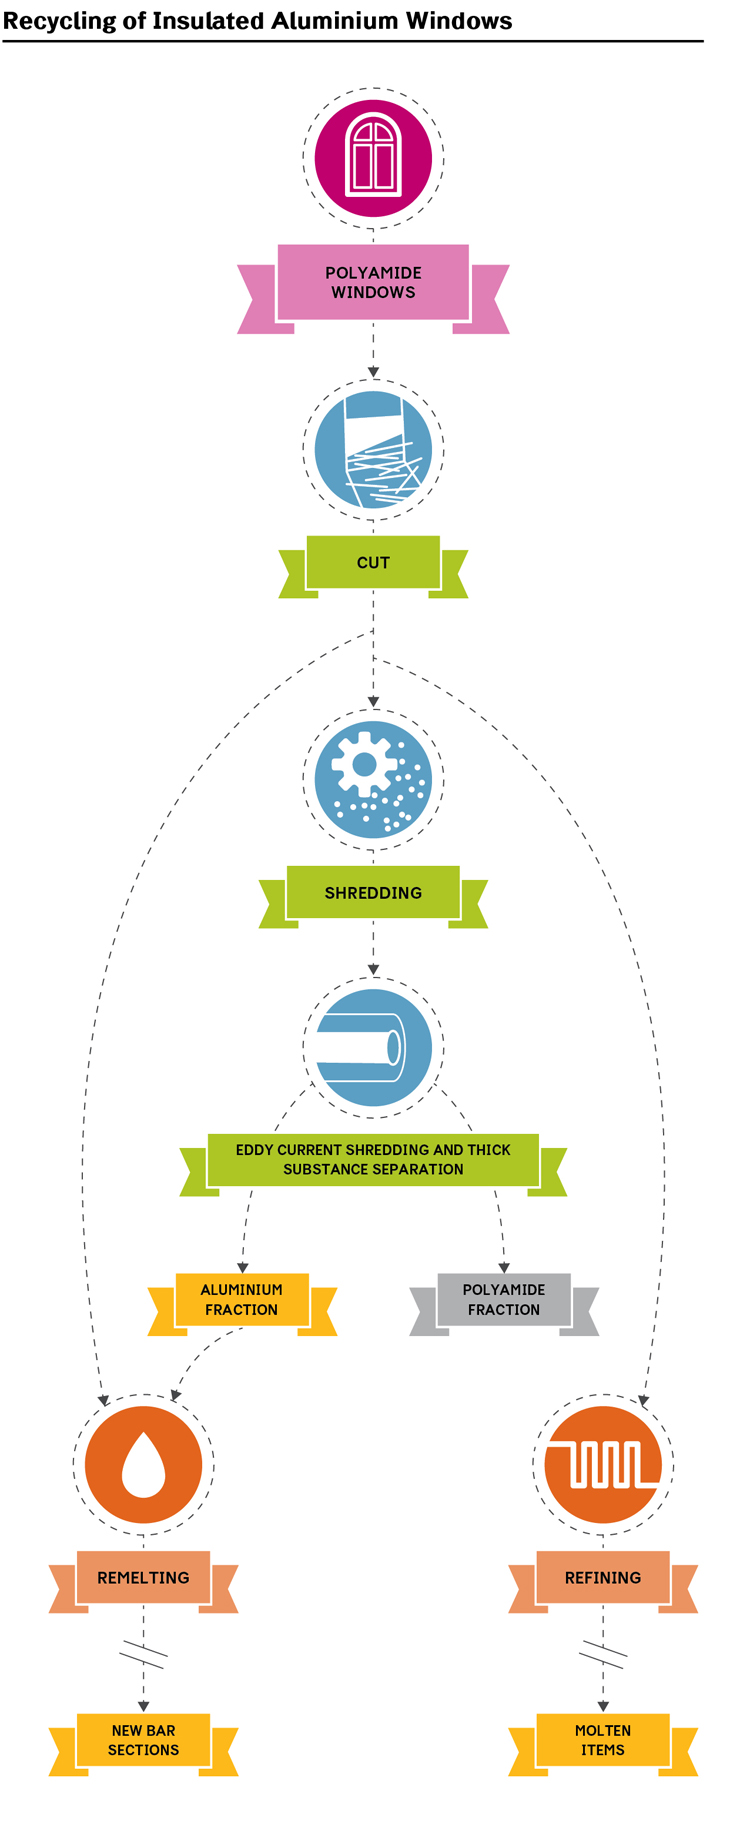
Doors and windows and panel recycling follow a well-established and efficient recovery procedure, through the same installation companies, guaranteeing 85-90% recycling. Scrap from doors and windows, casings and building uses can be estimated at around 110-130,000 tonnes per year (with a consumption of 4-4.5 million pieces a year in the mid 90’s.)
Products: Car Components and Means of Transport
In Italy, 35% of aluminium production has transport as its end-use target, with a strong production of engine blocks and other cast components. At a European level, 29% of aluminium is used for cars and about 12% for other means of transport (heavy vehicles, underground, trains, aircrafts, ships).
In motor vehicles, the average aluminium content is about 140 kg (2012 European average), with a higher percentage in D-segment vehicles (184 kg/vehicle) and E (301 kg/vehicle) and lower in A-segment vehicles (75 kg/vehicle) and B (109 kg/vehicle).
The main aluminium components in any vehicle are wheels, engine blocks, radiators and also structural parts. 73% of aluminium is made of castings, 13% of rolled products and 10% of extruded items.
The employment of aluminium in heavy vehicles for freight transport and electric vehicles for public transport (trams, undergrounds and trains) is considerable and still growing.
Aluminium Components (car fleet average)
Body: average 26 kg, about 20 components. Main uses: bonnet, doors, front structure, bumpers.
Chassis and shock absorbers: average 69 kg, about 17 components. Main uses: wheels, suspension arms, steering systems.
Transmission group: average 69 kg, about 25 components. Main uses: engine and head block, radiator, and gearbox.
Source: Ducker Worldwide: Aluminium Penetration Cars. Final Report, EAA 2012.
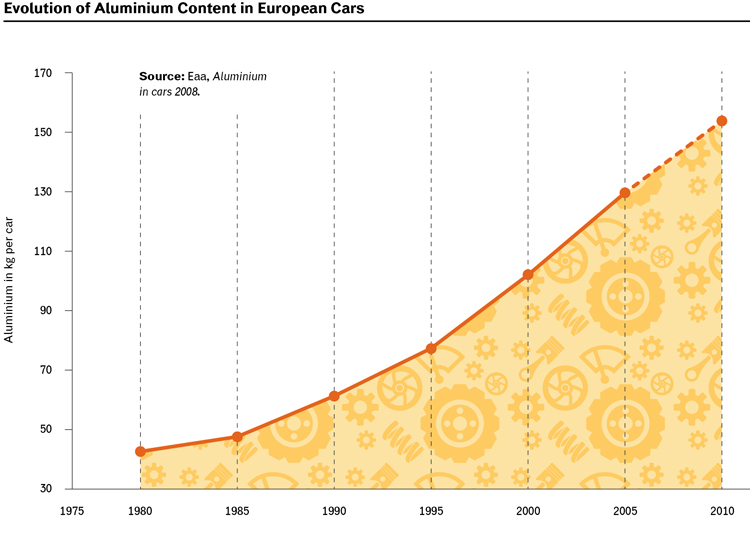
Evolution of the Use of Aluminium in Cars
Over time, the use of aluminium in means of transport experienced a strong growth. In Europe, the aluminium production for means of transport has more than doubled in 20 years: from 2.1 to 4.4 million tonnes. But, more importantly, the quantity of aluminium contained in cars keeps on growing, amounting to an average of 50 kg in 1985, to about 100 in 2000 and 140 in 2012. The quantity of aluminium is greater, even compared to weight, in the higher segments: it varies from 8% of the total weight in the A-segment vehicles (for instance Fiat Panda) to 10% in the C segment (for instance Ford Focus) up to 17% in the E segment (for instance Mercedes E-Class).
More aluminium in vehicles significantly contributes to a reduction in energy use and therefore in emissions.
The impact of aluminium on energy efficiency of vehicles is – first and foremost – determined by the reduction of mass due to the use of this material as a substitute for iron or copper materials. The energy necessary to move a vehicle is, with the exception of the aerodynamic resistance, directly proportional to its mass. The specific weight of aluminium (2,700 kg/m3) is about one third of that of steel, although in order to replace the mechanical parts it is necessary to increase the thickness of aluminium used. Therefore, the achieved weight reduction is about 50%. In other words, the use of 100 kg of aluminium replaces that of 200 kg of steel and therefore generates a net weight reduction of the vehicle of 100 kg.
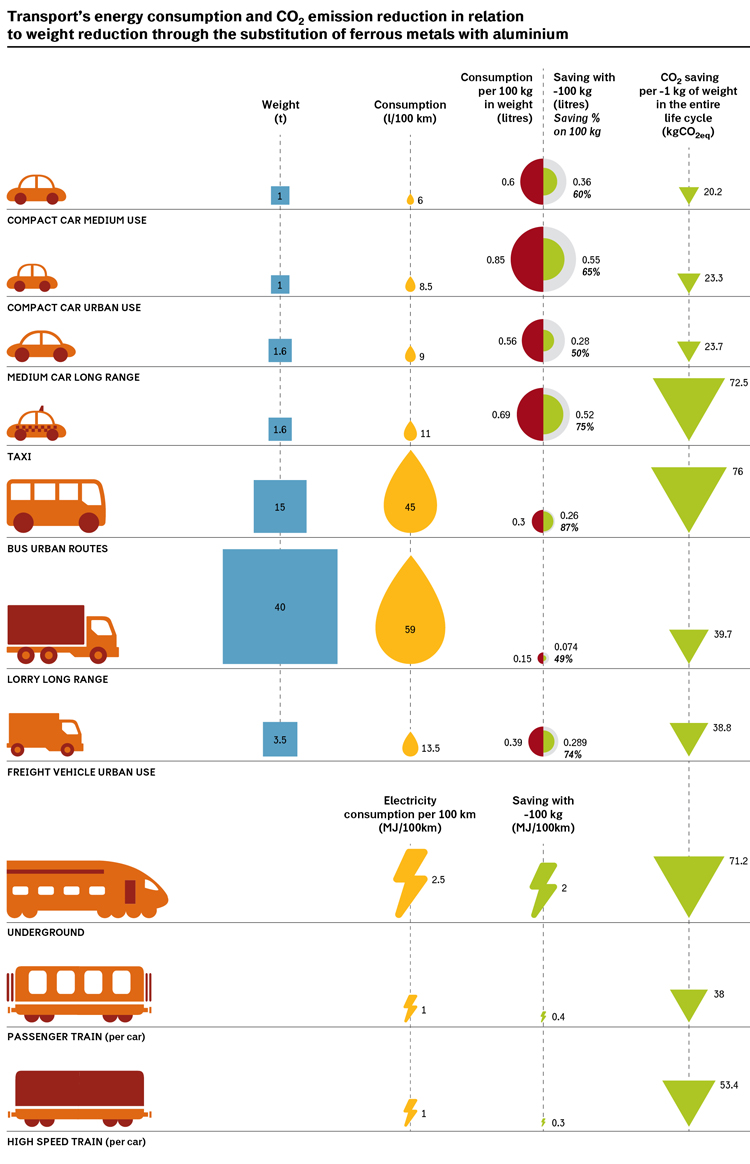
In a normal car, a mass reduction of 100 kg means a reduction of consumption of about 0.35 litres per 100 km and of 9 g of CO2 per km. This is tantamount to a reduction of 7% compared to current average emissions of the new EU car fleet, while the avoided emission over the whole life cycle amount to 20 tonnes of CO2 per vehicle.
Means of Transport’s Aluminium and Emissions
Heidelberg-based IFEU (Independent Institute for Energy and Environmental Research) and other authors studied the potential impact of the use of aluminium on the emissions of several types of means of transport (Helms H., U. Lambrecht, Energy savings by lightweighting, part II IFEU, 2004). The lesser the impact of air resistance, the greater the consumption reduction – for a certain vehicle, engine size and driving conditions being equal – is directly proportional to mass reduction. CO2 savings on the whole life cycle consider the average mileage of various vehicle types. For electric vehicles, CO2 emission reduction can vary, even considerably, according to the feeding mix of the electric system.
The actual quantity of usable aluminium while reducing other materials varies according to vehicle type. 100 kg of aluminium represent the current average content for lower-segment cars (about 140 is the average value of the new car fleet), while for lorries the average value is about 1,000 kg/vehicle (fluctuating between 500 and 3,000 according to the vehicle model). As for cars, over the next years, a growth of 40-50 kg of aluminium is expected.
Products: Furniture, Household and Personal Hygiene Items
Aluminium is widely used both in household and furniture items. Just taking into consideration household, kitchen and toilet items (including part of furniture items), in 2013 the Italian production amounted to 128,000 tonnes, with an apparent consumption (production+import-export) of 94,000 tonnes. Italy is characterized by a strong specialization both in terms of production (64% of European production) and consumption (34% of European apparent consumption).
Aluminium is used to produce furniture, bookcases, chairs, tables – both for indoor and outdoor uses – kitchens, pots and pans, bowls, coffee makers and personal hygiene products. In the production of kitchen items, it is used both pure and as a base for non-stick pots and pans coated with Teflon and other materials.
The life cycle of these consumer objects varies, generally between 3 to 20 years. The waste flow ends up partly in urban waste, partly in bulky waste and partly in industrial waste.
Products: Radiators and Heated Towel Rails
Both from an energy and economic point of view, one of the most efficient uses of aluminium is in radiators and heaters. Using recycled aluminium enables matter and energy consumption reduction for the same size compared to steel.Aluminium radiators are available in tubular and plate designs and can use both convection or radiation. The success of aluminium in radiators production is also due to the possibility to transform heating modules into design and furnishing items. Italy is one of the main global producers of radiators and heating devices made of recycled aluminium.
Aluminium Products’ Benefits for the Environment: Aluminium Efficiency for Heating
But above all, recent studies have shown that aluminium radiators guarantee better energy efficiency, particularly where there is no need for continuous usage. For the same heat output, aluminium radiators need far less water compared to the other two heating systems (28% less compared to cast iron and 45% less compared to steel): this means shorter heating times and less boiler’s usage thus reducing energy costs.
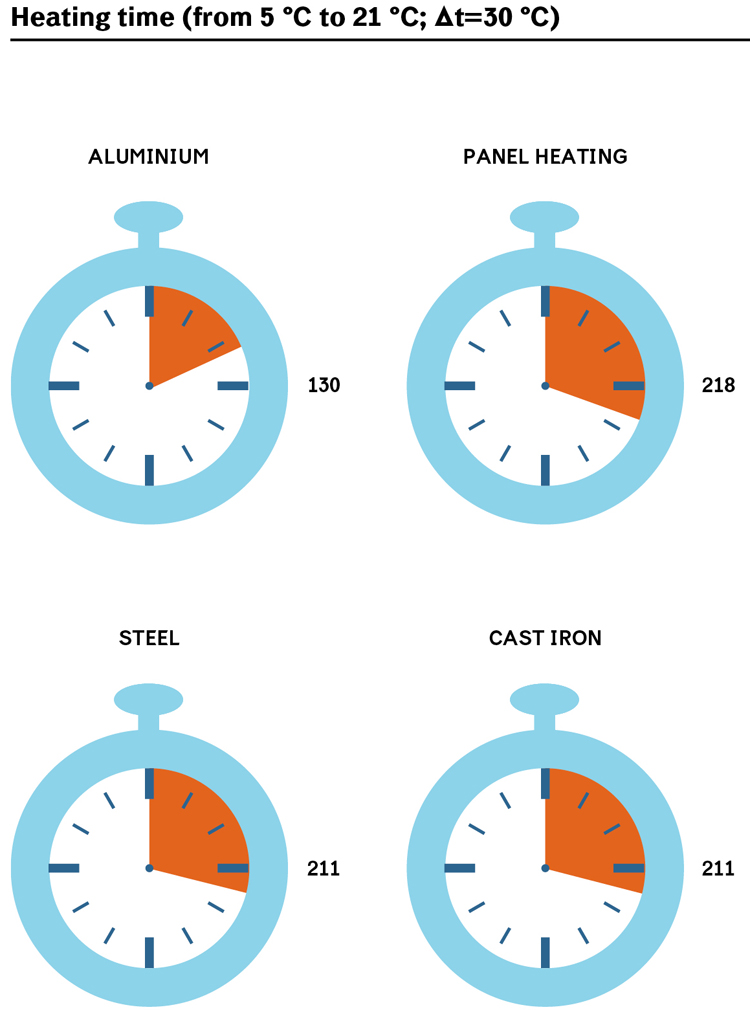
It takes half the time to get a heating system with aluminium radiators up and running compared to those with cast iron and steel radiators or panel heating.
Less water, shorter heating times, less weight, these are the factors that make aluminium radiators extremely fast in changing room temperature to adapt to different needs.
Aluminium radiators are also better than panel heating. According to studies carried out by Florence University’s Energy Department, aluminium radiators have a lower energy consumption varying from 5% (for conduction with fixed constant temperature, ideal for panel heating) to up to 40% for intermittent heating systems.
Products: Use in Electrical and Electronic Equipment
Aluminium is widely used in electrical applications together and in competition with copper. In particular, aluminium is used in bare and insulated cables for transporting and distributing electricity or in internal cables for industrial use.
Thanks to its functional and aesthetic characteristics, aluminium is also used, although to a lesser degree, in electrical and electronic devices, from computer and refrigerator casing to heatsinks, air conditioning units and holders for screens and monitors.
In Italy, the overall use in electrical and electronic devices amounts to approximately 20,000 tonnes per year.
Albeit increasingly subject to separate collection, this consumption flow has progressively shorter life cycles, unlike other more industrial and engineering applications.
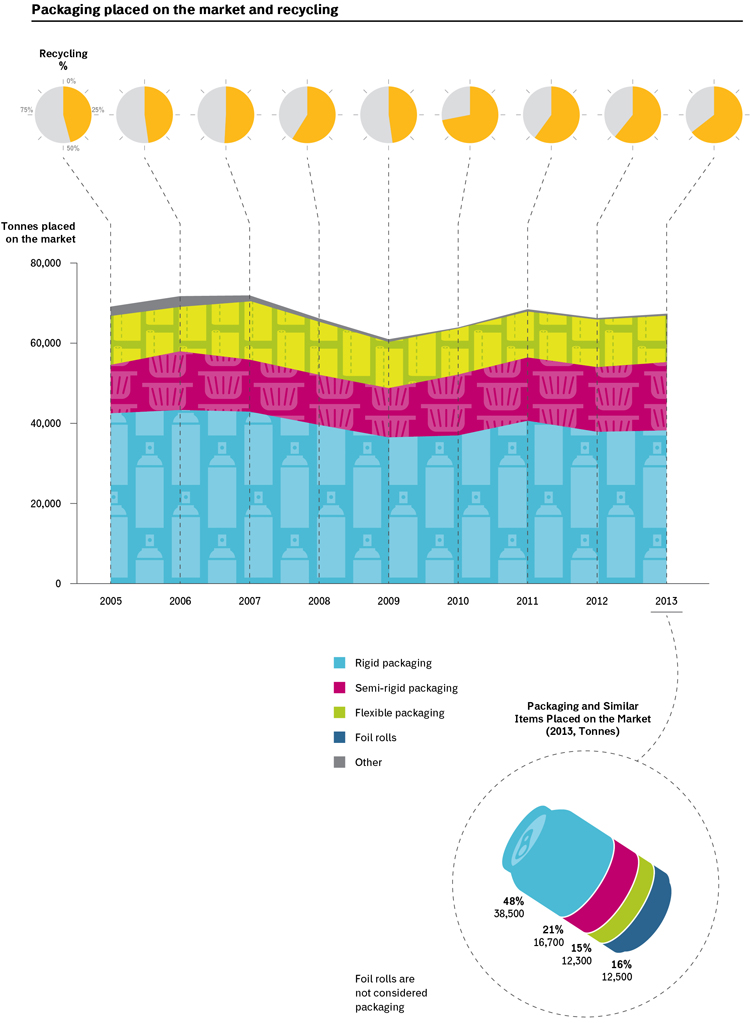
Products: Packaging
Thanks to its characteristics, ideal both for the optimization of product’s preservation (it guarantees long shelf life thus reducing waste) and of transport rationalization and matter use (for its lightness), aluminium is widely used in packaging. It is used to manufacture cans and tins for drinks or solid food, trays and tubes both for food and non-food use, foil to pack loose products or as a component of polylaminate items.
Net of packaged food and product import and export, in Italy consumption is substantially stable, amounting to 67,000 tonnes in 2013. Per capita consumption (1 kg per person) is in line with that of Germany, but is less than half that of the UK and Nordic countries. Besides packaging known as such, the consumption for aluminium sheets for the same purpose amounts to 13,000 tonnes per year.
Packaging aluminium has an extremely short life cycle, conventionally around a year. For its characteristics, aluminium and similar packaging are included in urban waste.
Mines of Secondary Aluminium
Secondary Aluminium Mines Are still Untapped
Production waste on the one hand and waste and used products on the other represent the huge mines of secondary aluminium.
These mines have an enormous economic and environmental intrinsic value.
While production waste (pre consumer) is recovered almost completely, the reconstruction of post-consumer waste flows is still rather complicated. Especially because there is the possibility that a huge recovery and trade grey area exists that escapes for example data gathering for tax reasons.
The quantity of waste generated every year varies between 400,000 and 500,000 tonnes. Post-consumer waste and scrap deriving from different uses are partly made up of homogeneous aluminium products (as it is the case for packaging and cables). Partly from components of other products (as it is the case for vehicle and electronic devices components).
Not all this waste is, at least seemingly, actually recovered.
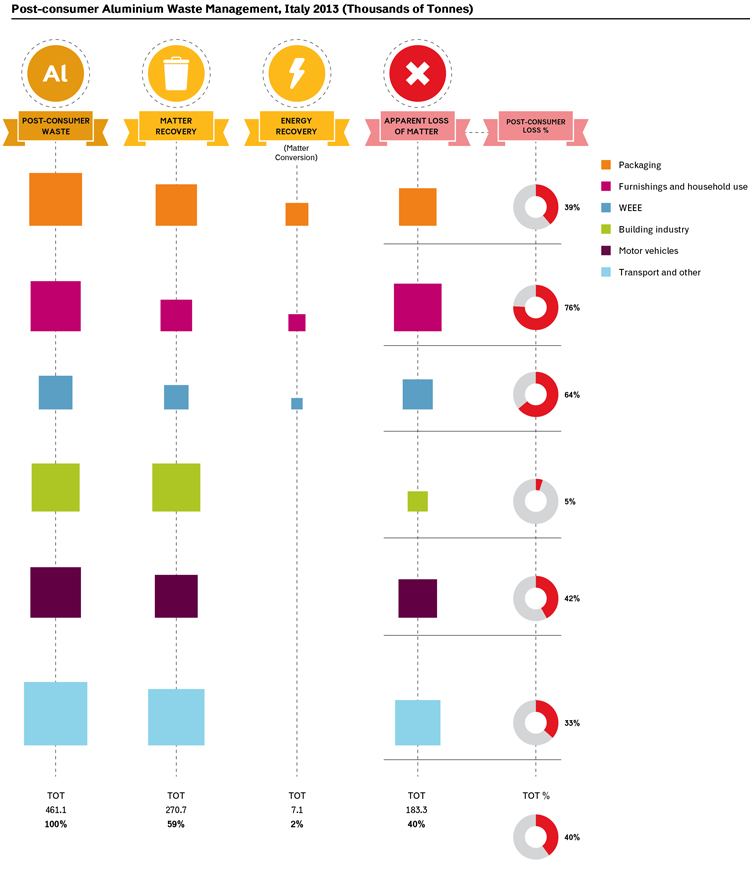
In fact, secondary aluminium “urban mines” still seem very rich: the ostensible total loss of aluminium, due to urban and industrial uses, is about 40%.
Actually, in some cases this loss can be as high as 58% of the total urban flows, 40% for packaging and similar uses, and over one third for end-of-life motor vehicles.
There is strong evidence suggesting huge wastage and loss above all in flows destined to the urban waste circuit: aluminium foil packaging and other types of flexible and semi-rigid packaging, everyday objects and furnishing items, components of electrical and electronic devices waste, and aluminium in incineration waste are only partly recovered.
From a potential recovery point of view, end-of-life motor vehicles are another seemingly critical area (unless we have incomplete data).
This failed recovery of aluminium is thought to amount to a potential loss of the recycling sector of €350 million and 1,350 jobs.
Post-Consumer Scrap Accounting Methodology
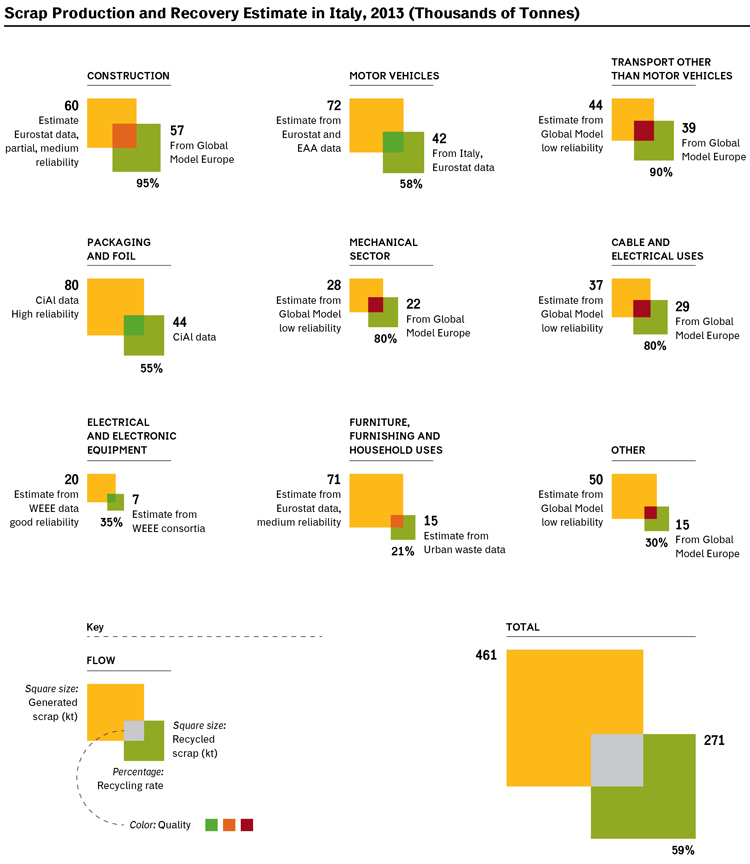
Produced Flows
Aluminium waste flows must be calculated together with historical consumption and products’ life cycles. For waste deriving from packaging, it is assumed that consumption in 2013 (CiAl data), including the consumption of wrapping foils that cannot be considered packaging (13,000 tonnes), was 80,000 tonnes/y.
For waste deriving from motor vehicles, it is estimated that the average content of aluminium is 80 kg/vehicle in about 900,000 scrapped vehicles (Eurostat data, 2013).
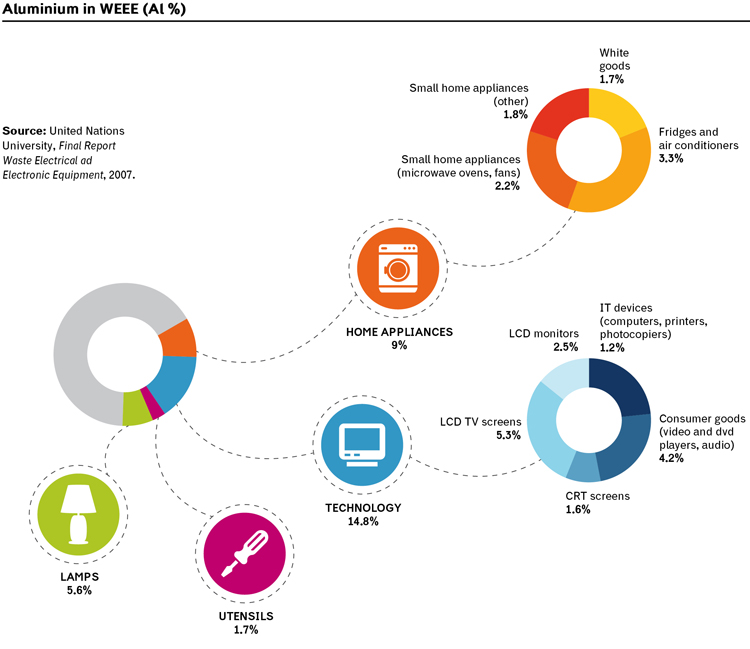
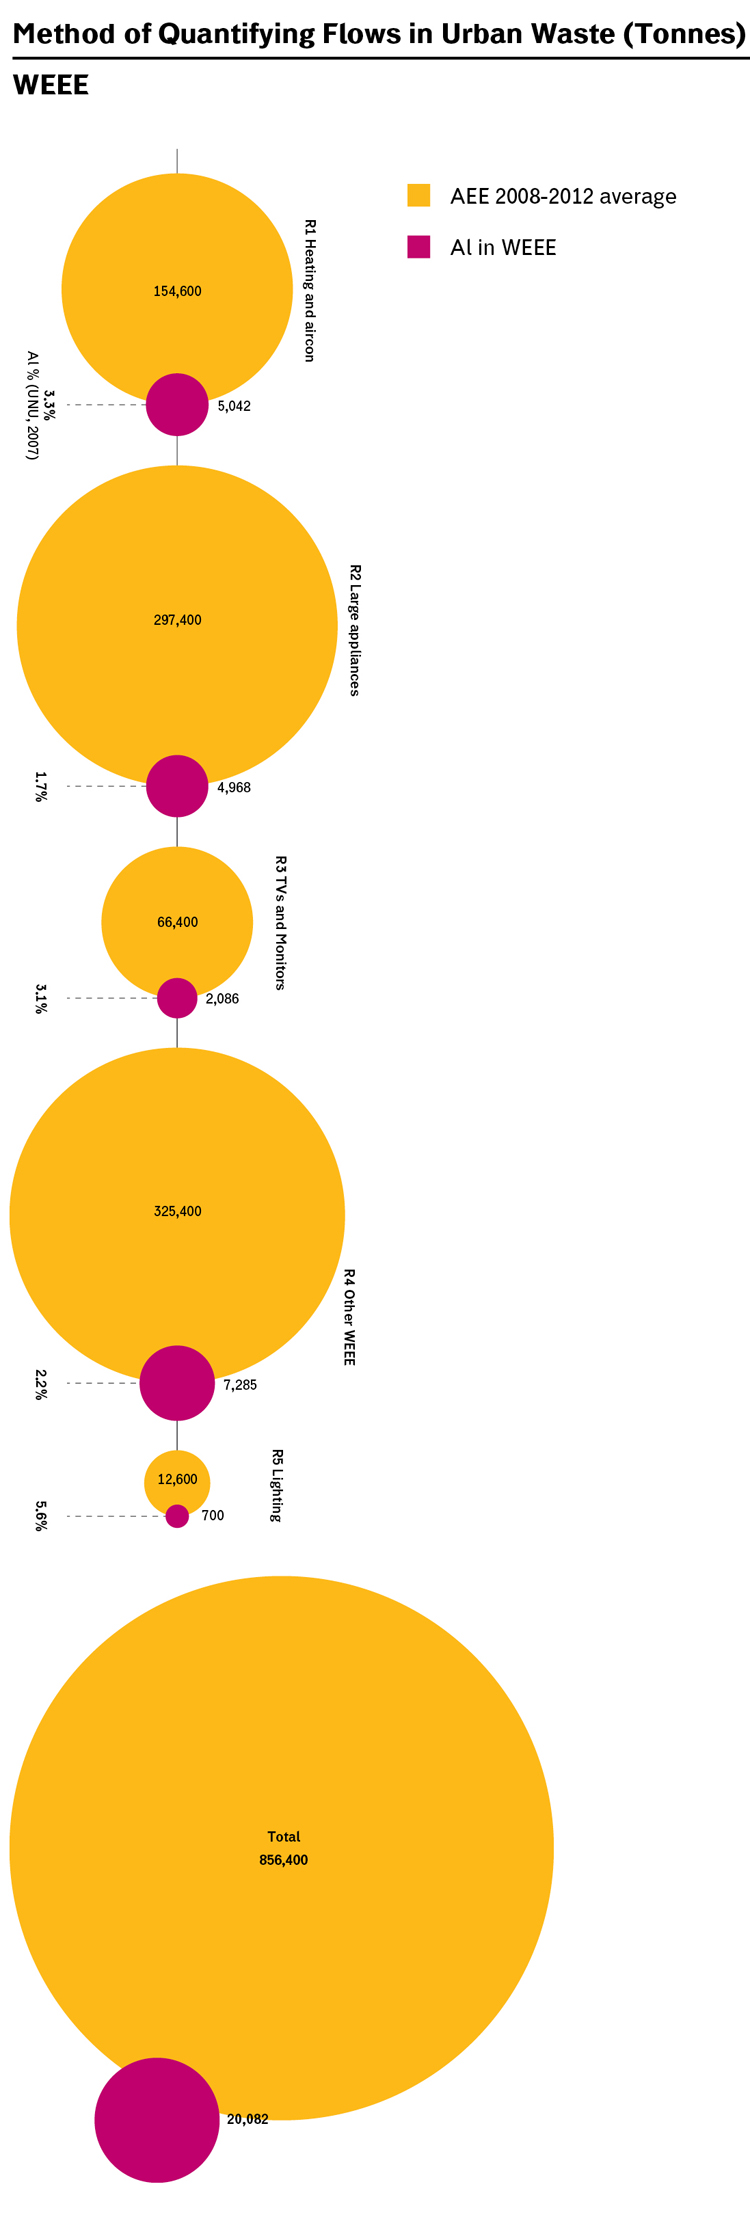
For waste deriving from electrical devices, a specific evaluation was carried out on the content of aluminium in WEEE, demonstrating that they generate 20,000 tonnes/y.
For waste deriving from household use and furniture, it was estimated – based on Eurostat apparent consumption data and the average over the last ten years – at about 71,000 tonnes/y.
Overall, the building industry is thought to generate a flow of 60,000 tonnes/y. It must be pointed out though that there are no specific data on scrap aluminium deriving from construction uses and buildings. In the first five years of the 21st century, the consumption in frames and casings for doors and windows amounted to about 4.7 million pieces, about 40-50,000 tonnes, but in previous years – particularly in the 1980s, period from which the current scrap derives – the consumption is thought to be lower. The structural use of aluminium in buildings is even more recent: according to the available data for the first half of the 1990s, consumption was lower than 20,000 tonnes/y, while in the second half the average exceeded 200,000 tonnes/y. Even for aluminium used in cables and other electrical materials, in the mechanical sector, in transport means other than motor vehicles – the so-called “other uses” – we do not have specific data and the calculation is derived from that of the EAA global model, assuming for these fractions that the amount of scrap produced in Italy is equivalent to the quantity of the 2013 global estimate of generated scrap which assigned to Italy a share (2.6%) of the global amount of “aluminium in use”. The total of these items (with low reliability) amounts to 158,000 tonnes.
Recovered Flows
Recovered flows from the waste chain are based on data from CiAl (packaging), WEEE consortia (WEEE waste) and other sources from urban waste management.
Recovery from end-of-life vehicles is derived from the Eurostat management of end-of-life vehicles.
For other flows, we used estimates by the Global Model Europe of the International Aluminium Institute.
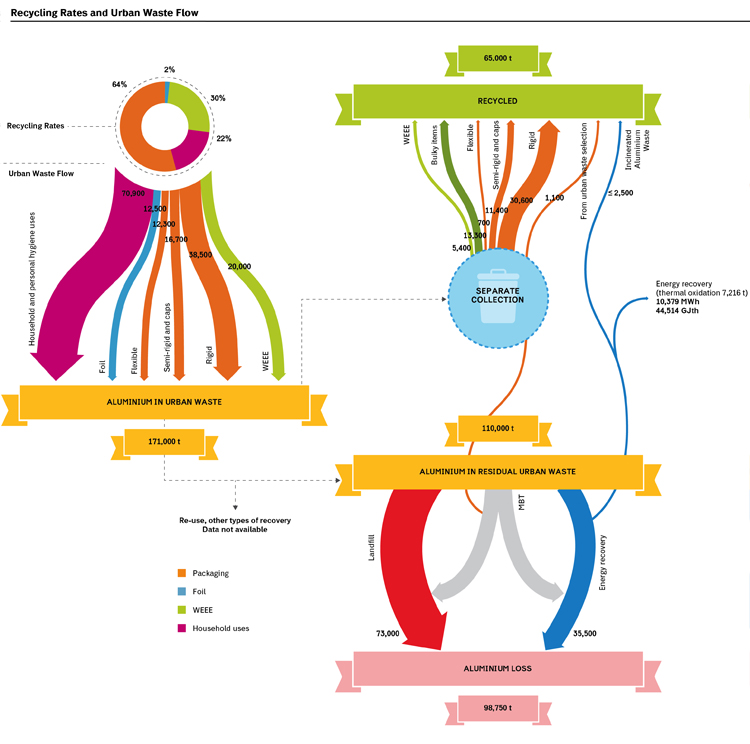
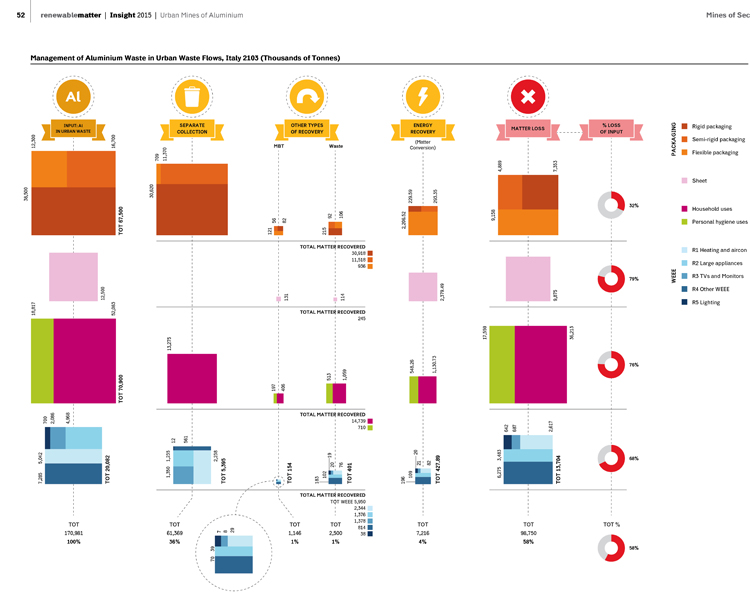
Urban Waste Flow
A total recycling rate of 38% and a loss of over 50% of aluminium.
Household waste contains about 171,000 tonnes of aluminium, less than half is packaging. The “household and personal hygiene use” portion also includes furnishing, furniture and bulky items.
Through separate collection and, marginally, through sorting and recovery of residual waste, 65,000 tonnes are recycled every year, amounting to only 38%.
There might be other types of recovery of part of aluminium flows (for instance, furniture and furnishing items) outside the urban waste network, but they cannot be assessed and verified.
Through incineration, as such or Solid Fuels Secondary (CSS), it is estimated that energy conversion amount to about 7,000 tonnes, producing 11 GWh.
These data reveal a loss of aluminium equal to about 99,000 tonnes/y, representing 58% of waste production.
Method of Quantifying Flows in Urban Waste
Flows in urban waste are calculated as follows:
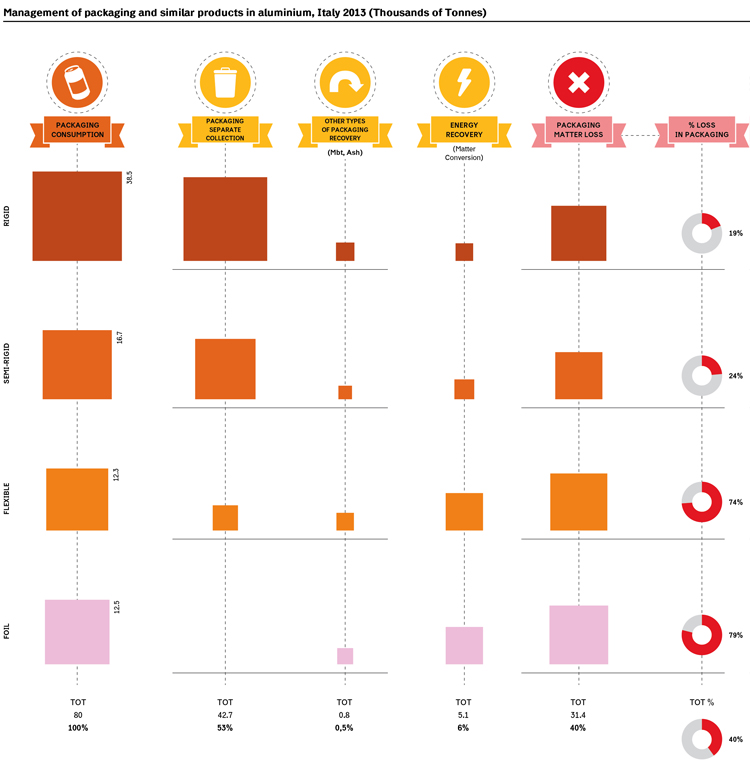
Packaging. This is the amount of packaging used in Italy as determined by CONAI, it does not include minor fractions of packaging – for instance pharmaceutical blisters – that are not subject to regulations. Packaging is divided into rigid packaging (cans, aerosols, tins), semi-rigid packaging (trays, tubes, caps) and flexible packaging (foil, film and polylaminate items made mainly of aluminium) and other undefined packaging.
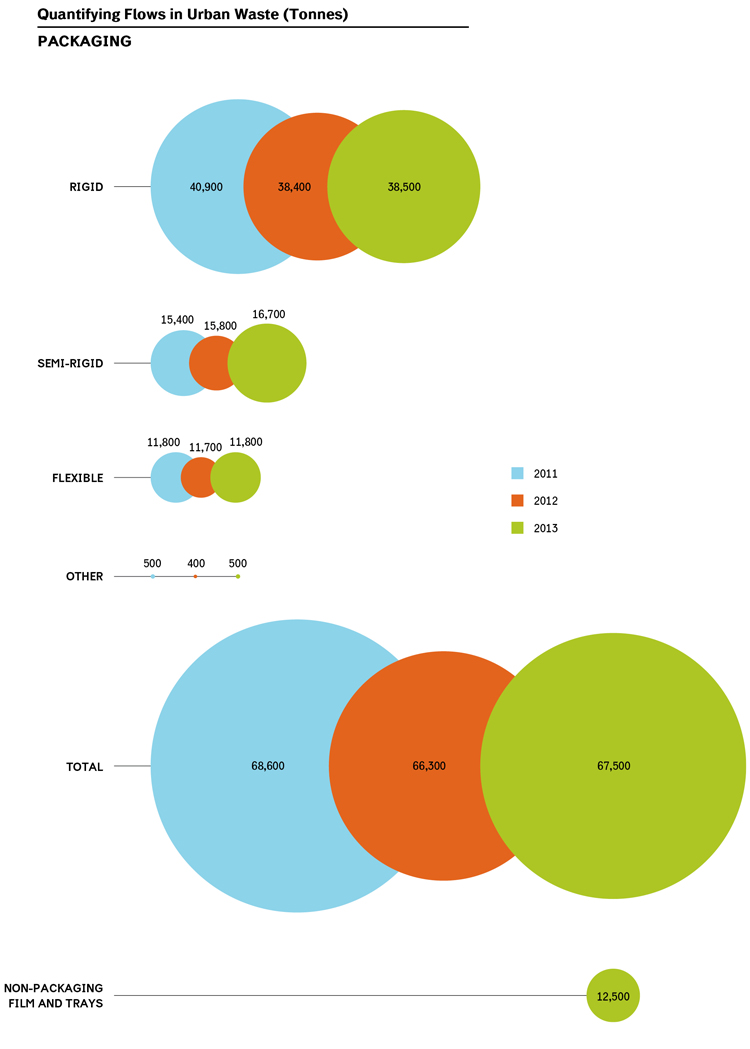
Foil rolls and other containers. Foil and film rolls and other containers that are not subject to Conai environmental levy. According to CiAl data, they amounted to 12,500 tonnes in 2013.
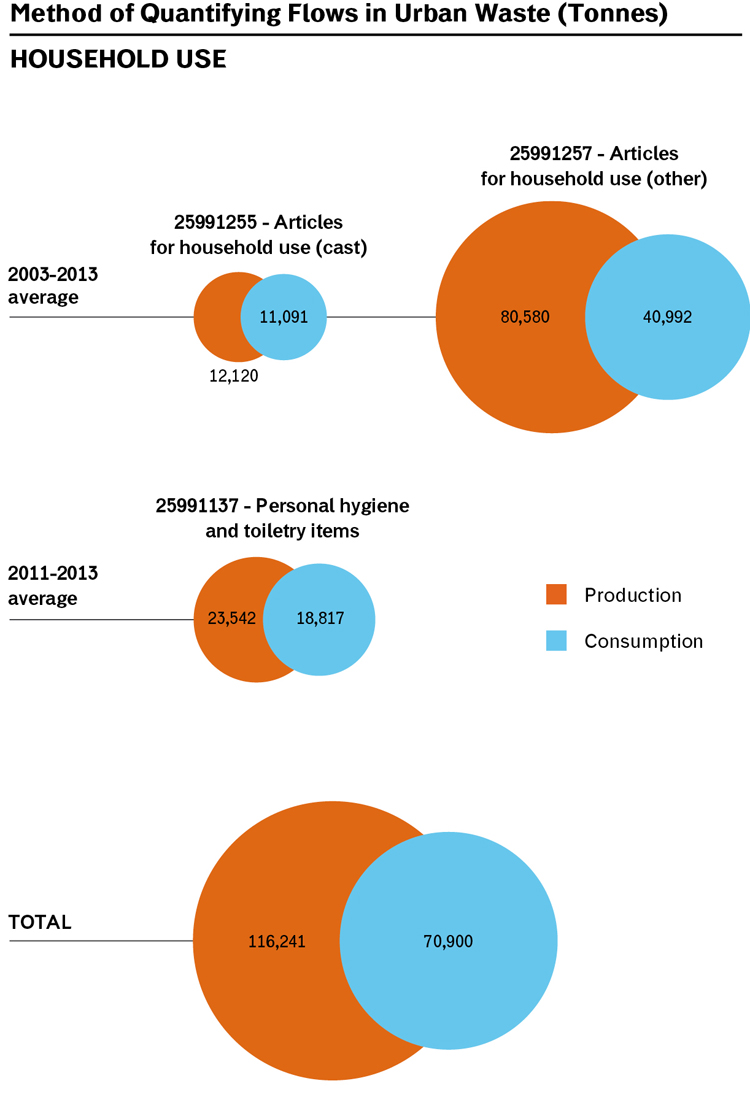
Household uses. They include apparent consumption (production – export + import) of those products belonging to Prodcom 25991255 and 25991257 (that is household and kitchen items and their aluminium components – aluminium deriving from casting or other types of metalworking) and 25991137 (personal hygiene and toiletry items). It mainly includes batteries of kitchen utensils, pots and pans, various household devices, furniture items entirely made of aluminium (such as tables, chairs, kitchen worktops) and scrubbing pads. Since these products have a life cycle longer than a year, calculations were made using the 2003-2013 average for household uses, and 2011-2013 for hygiene articles; these calculations also include the weight of other assembled items.
WEEE. They include aluminium components of electrical and electronic equipment; their quantity is calculated using the average content of aluminium for each product category multiplied by the number of devices placed on the market (an average of the 2008-2012 period; regulations though provide for considering the collection rate based on the average of the quantity placed on the market over the last 3 years). The average aluminium content for each product category is derived from the UNU 2007 Study (United Nations University, 2008 Review of Directive on Waste Electrical and Electronic Equipment). The reported values are in line with the percentage of aluminium recovered in each product category.
Excluded flows. This calculation does not include, because unascertainable, the quantification of aluminium in furnishings items, if not included in “household uses”. It does not include fixtures (doors, windows, casings) generated by house renovations and disposed of through urban waste collection.
Method of Quantifying Recovery from Urban Waste
Recovery of aluminium products for recycling has been determined using the following criteria.
Packaging. It is the quantity of packaging sent for recycling determined by CiAl; the classification in rigid, semi-rigid and flexible packaging is based on the composition sent to CiAl. The total quantity (43,900 tonnes) includes semi-rigid packaging material from capsules and caps selected from glass collection (about 8,900 tonnes/y, calculation based on the quantity sent to CiAl compared to the total amount of recycled packaging), limited quantities (about 1,100 tonnes/y, calculation based on quantity sent to CiAl compared to the total amount collected) from residual waste separators in MBT (Mechanical Biological Treatment) plants and aluminium nodules recovered from waste incineration (sent to CiAl and amounting to 55 tonnes).
Bulky items. The amount of aluminium recovered through bulky waste collection networks and centres (aluminium items for household and personal hygiene uses) has been calculated taking into account bulky items direct recovery and non-ferrous fraction recovery in collection centres. On a 398,000-tonne flow of recovered bulky items (ISPRA data, 2014), it has been calculated that aluminium represents up to 7.5% of the total quantity of metals recovered from bulky items (in accordance with the Wrap composition of bulky items, since there are no data available for Italy), amounting to about 4,000 tonnes/y. To this quantity, we must add 15,000 tonnes deriving from waste sent to “non-ferrous metal” collection centres, calculation based on Regione Lombardia data (3,021 tonnes), using Lombardy total rate of separate collection on the Italian total, attributing aluminium a rate of 75% of the total.
WEEE. The quantity of aluminium recovered from WEEE, not available as aggregate data from WEEE Centro di Coordinamento (coordination centre), has been calculated for groups R1 and R2 based on recycling rate (3.6% and 2.2% of the WEEE flow respectively) measured by Ecodom (the leading collective consortium of one of the two groups); as for R3 group, the average recycling rate (1.96%) measured by Remedia (the leading consortium of this group) was used; as for groups R4 and R5, the recycling rate measured by Ecolight (1.49% and 1.05% respectively) was used.
MBT. Mechanical biological treatment plants are only partly equipped with Eddy Current Separators, ECS, that use induced current. It has been assumed that the quantity of aluminium recovered through MBT amounts to the quantity collected by CiAl, slightly over 1,100 tonnes/y.
Ash. Data on the quantity of aluminium recovered from ash (less than 2,500 tonnes) have been calculated assuming that they are treated adequately for aluminium separation, about 350,000 tonnes of bottom ash out of 580,000 tonnes sent to the recovery system. This is in line with Federambiente 2013 estimate on the quantity of bottom ash only sent to recovery and assuming an aluminium recovery rate of 0.7% of the amount found in some plants, albeit lower than the theoretical potential. For the recovery of ash, we used the nominal potential operation of the following plants, Lacchiarella (120,000 tonnes), Noceto (50,000 tonnes), Modena (30,000 tonnes), Conselve (150,000 ton), Massafra (5,000 tonnes).
Packaging Separate Collection and Recycling
In most Italian municipalities, aluminium separate collection is understood as “aluminium packaging” collection: in particular cans, even though CiAl also accepts the so-called “similar fractions”, that is household aluminium objects other than packaging (containers, coffee makers, pans and pots, foil etc.)
Separate collection of aluminium is carried out in four different ways:
- “light polymaterial” (aluminium, steel and plastic packaging), reaching about 43% of the population, this method is expanding;
- “heavy polymaterial” (aluminium, steel, glass and plastic packaging) reaching about 32% of the population, this method is declining;
- “glass and metals” (aluminium, steel and glass packaging), reaching 18% of the population, common in public areas;
- “mono-metal” (aluminium and steel) common in some areas in Emilia Romagna, Sardinia and Trentino Alto Adige. It reaches the remaining 7% of the population.
Since aluminium collection is always combined with that of other materials, the quantification of collected aluminium is carried out before sorting: according to ISPRA data, in 2013 the separate collection of metal packaging (steel and aluminium) amounted to 96,900 tonnes.
According to CiAl data, the separate collection of aluminium packaging – excluding the quantity due to residual waste sorting – amounted to 42,700 tonnes, mainly deriving from urban separate collection flows. Matter recovery from aluminium packaging (calculated using the quantity collected by CiAl, which represents 25% of the total collection), 97% of packaging deriving from separate collection and the remaining % from residual waste treatment (in MBT and ash).
Rigid packaging (cans, aerosols and tins) represents 70% of separate collection, semi-rigid packaging (tray, tubes and above all caps and capsules) makes up about 26%, and the reaming percentage is made up by flexible foil packaging.
So, the recovery rate compared to consumption is very high for cans and rigid packaging (79.5%), high for semi-rigid packaging (about 68%), but almost negligible for flexible packaging (6% if calculated only on foil classified as packaging, less than 3 % if calculated on the total amount of aluminium foil).
In the packaging sector there is a high loss of flexible packaging, because it is not exploited or collected separately or because it is not adequately separated by ECS plants on the sorting flows of polymaterial collection and MBTs.
So, taking into account the recovery from ash and energy conversion of part of aluminium, 40% of matter contained in packaging and similar products is lost.
Mechanical Recovery from Urban Waste
Recovery of aluminium – and of other non-ferrous metals – is carried out with Eddy current separators (ECS) based on the principle of induced current (or passive currents or Foucault currents) created by a rotating magnetic field.
ECSs are used in polymaterial sorting plants, separating metals from plastics or metals from glass.
In 2013, 55% of the 178 packaging treatment plants – that is 98 plants – was equipped with ECSs.
On the contrary, MBT plants are rarely equipped with ECSs, although they process just under 10 million tonnes of waste, as well as plants for the recovery of bulky items. In 2013, CiAl took waste from 11 MBT plants amounting to just over 1,000 tonnes. The latest disaggregated data available at national level for 2010 indicate that there were 13 plants processing 869 tonnes of non-ferrous metals (with yields, compared to the input waste flow, varying from less than 0.01% to 0.3 %).
It is reasonable to think that the high loss of household-use aluminium is due to the lack of adequate detection systems.
Aluminium Recovery from Urban Waste Ashes
During incineration, only a fraction of aluminium is oxidized producing energy. The remaining fraction of non-oxidized metallic aluminium, theoretically available for recycling, is found in bottom ash, in fly ashes and in reaction’s salts and deposits.
In fly ash, aluminium is mainly in oxidized form, high level of oxidation can also be found in bottom ashes’ fine fractions.
The highest amount of metallic aluminium can be found in bottom ashes’ “non-fine” fractions (> 0.5 mm).
Recovery through ECSs is efficient only with heavy fractions (>0.8 mm) contained in bottom ash; thanks to the use of new technologies (Wet ECS) we envisage an improvement of the detection capacity even in finer fractions.
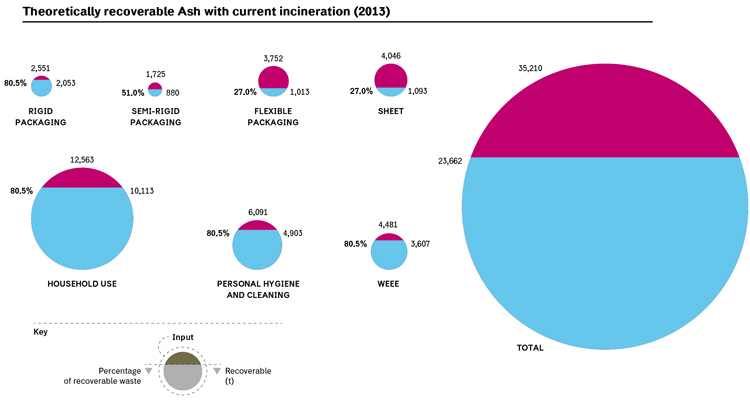
The percentage of aluminium that can be theoretically recovered varies according to the type of material: from over 80% for cans to 51% for semi-rigid packaging and down to 27% for foil (Biganzoli, Grosso et al., 2012, 2014). For products other than packaging the percentage is expected to be similar to that of cans.
Out of the total of incinerated waste, based on waste composition and rates of separation, we can expect a recovery potential of up to 23,000 tonnes/y, equal to about 2.8% of generated ash, an amount in line with estimates of 2.3 % at European level.
Only with ECS systems adequately created to detect different particle sizes, real recovery can be as high as theoretical recovery.
At present, recovery in some plants is remarkably lower than theoretical recovery. Recovery potential estimate is 10 times higher than what is currently recovered, processing only a fraction of ash and with inadequate technologies.
Aluminium separation technologies in urban waste flows
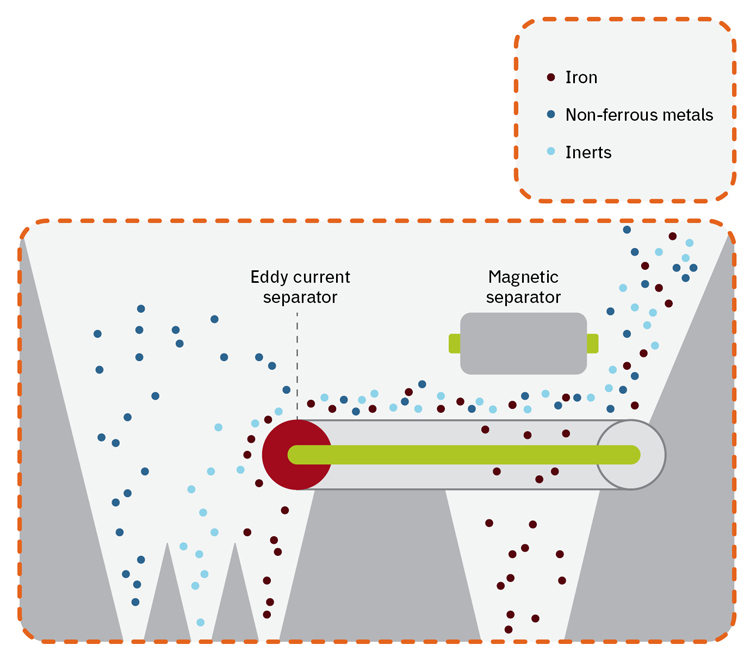
In non-ferrous metal separation plants, materials are first subjected to magnetic separation and then offloaded on a vibrating belt feeder that spreads them out and controls the flow. The ECS conveyor belt’s speed can vary as well as that of the magnetic rotor (inductor). Induced currents going through non-ferrous metals to be separated create such a repulsion force that they jump thus separating from inert material.
Normally, they are separated in three different flows that are fed to three different hoppers, one for ferrous metals, a central one for inert material, and the outermost for non-ferrous metals.
Separation performance largely depends on operating conditions, on speed and on the distance of the various materials from the conveyor belt. Operating conditions of urban waste selection cannot guarantee, due to productivity reasons, an efficient detection of non-ferrous materials.
To a limited extent, ECS systems ensure the separation of different non-ferrous metals thanks to their unique mechanical and electrical properties; but a higher purity, especially in the separation of aluminium from copper, can be achieved with further density and floatation separation treatments (integrable potentials) or spectrometers (rarely used).
There are several types of ECS systems (concentric, eccentric, dry and wet systems) that must be optimized according to their use and in particular according to the aluminium particles’ size. The separation of fine particles requires different devices from those used for coarse materials.
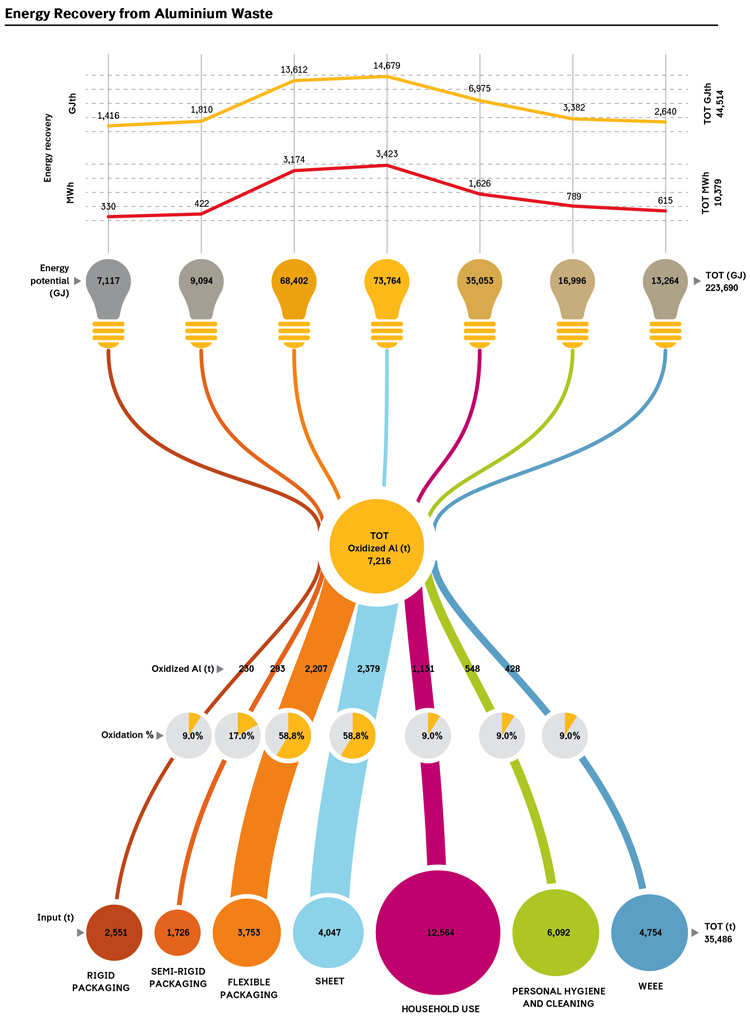
Energy Recovery from Aluminium Waste
Thermal treatment of aluminium partly oxidizes it, especially thinner materials (film and thin foil). During the oxidation process, aluminium releases energy, conventionally calculated as amounting to 31 MJ/kg, available for thermal recovery or electric conversion. That can be turned into thermal energy or electricity. The percentage of oxidizable aluminium is different and varies according to products and their thickness. CEN 13431:2004 assumes than aluminium with a thickness < 50 micron is entirely oxidized during the incineration process. However, recent studies (Biganzoli, Grosso 2012, 2014; Pruvost 2013, Lopez et al. 2013) have demonstrated that the oxidized fraction is actually lower than previously thought, especially in thin foil. This is due to the fact that during incineration molten aluminium tends to form tiny nuggets that drastically reduce the surface exposed to oxidation compared to the foil’s original surface (Pruvost, 2013).
According to experimental estimates, the oxidation rate for packaging materials varies from 59% for foil to 9% for cans, a rate that with due caution can be expected for other aluminium items.
On the total amount of aluminium waste in dry residue (assuming an incineration rate similar to the Italian average of dry residue) theoretical energy production amounts to about 223,000 GJ. With current yields – calculated assuming an average production on waste with a calorific value lower than 10MJ/Kg, 464 KWh/t and 1.99 GJ/t – the actual energy recovery amounts to 10,379 MWh and 44,514 GJ, an average yield of 36.6%
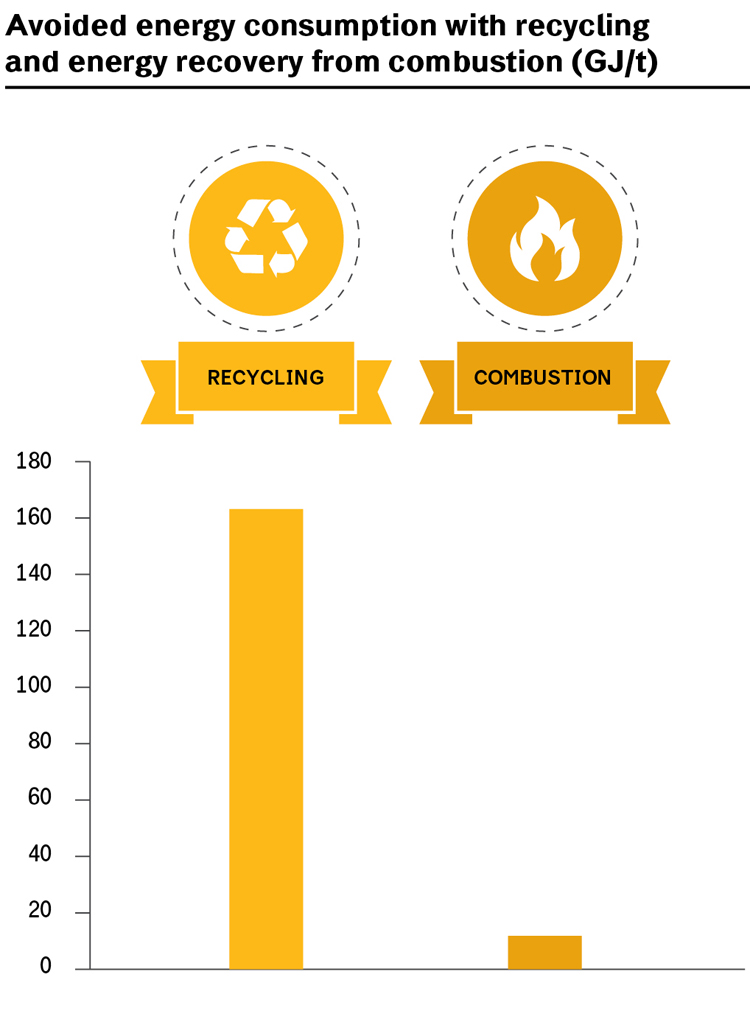
So, even with maximum efficiency, energy recovery through incineration offers an energy saving lower than 10% of that obtained through recycling.
Aluminium Recovery from Car Scrapping: A Source only Partially Exploited?
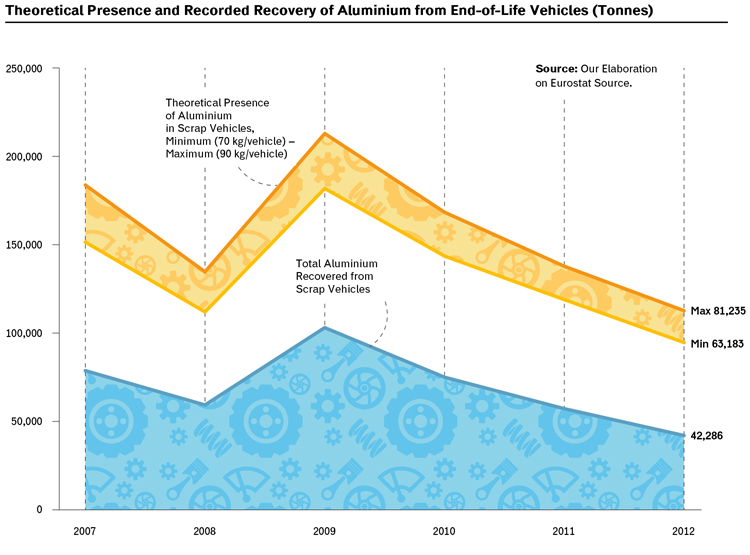
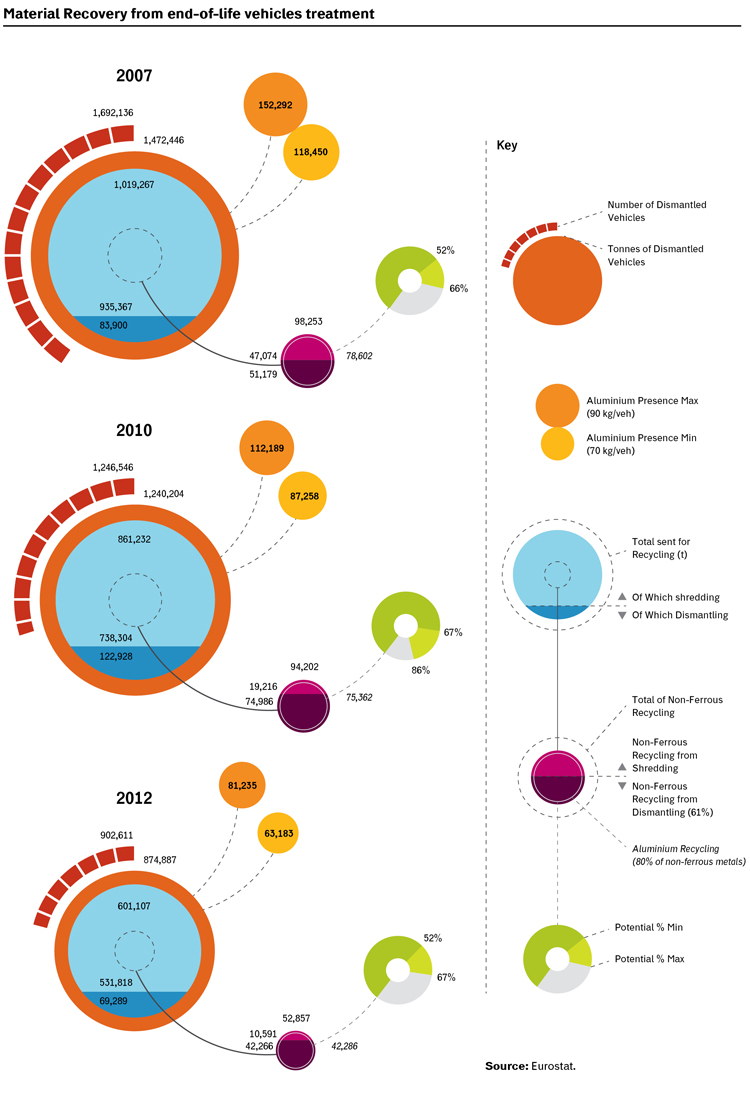
Motor vehicles represent one of the main sources of aluminium scrap. Over the years, the aluminium content in motor vehicles has progressively grown. According to estimates dating back to the 90’s – where data on scrapped cars originated – point to about 70/90 kg per vehicle of aluminium. In theory, therefore, the aluminium content of scrapped cars in 2012 can be estimated between 63,000 to 81,000 tonnes.
On the basis of this theoretical amount, the total of non-ferrous materials (including lead and copper as well) being sent to recycling amounts to a mere 10,591. Even considering other loosely defined materials as part of the recycling quota (69,000 tonnes of which – 60% – as in other countries such as Germany, France and Spain, are made of non-ferrous materials) the total of non-ferrous scrap is estimated at around 53,000 tonnes, of which about 80% is made of aluminium, equalling 42,000 tonnes/year, between half and two thirds of the estimated amount.
Despite being just estimates, the gap appears significant and points to an important and underestimated aluminium flow, roughly 40%.
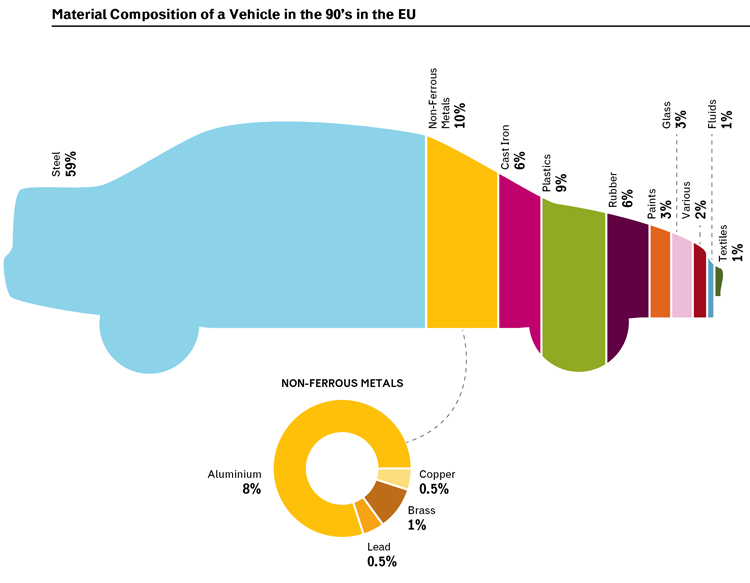
EU Composition of Vehicle Materials in the 90s
The composition of motor vehicles used is based on the assessment of the average composition of European car producers in 1998 published in Kanari, Pineau, Shallari, 2003 (“End of Life Recycling in the European Union”, The Minerals, Metals and Materials Society).
1998 can be considered a significant point of reference for the composition of 2012-2013 scrap. The amount of aluminium is higher in cars with a bigger engine, therefore there is a variability due to the characteristics of the national car fleet (see EAA, Aluminium in Cars, 2008; Bio-Ghk Study to examine cost and benefits of ELV directive, 2006).
The subdivision of all non-ferrous metals is particularly important for subsequent estimates – not disaggregated to recovery and composition of vehicles statistical data. Overall, non-ferrous metals amount to 10% of a car average weight, but cars also contain brass, copper and lead besides aluminium. Margarido et al. (2014), revising a series of studies, suggest a percentage of aluminium in end-of-life vehicles of 78% (with 12% brass and 5% copper), similar to the value of the Kanari et al. 2003 study.
Methodology for Quantifying Aluminium Waste from Motor Vehicles
Aluminium Flow in End-of-Life Motor Vehicles
Available data register a presence of aluminium in motor vehicles produced in the 90’s representing today’s total end-of-life vehicles and scrap of around 8% of a car total weight (a car average weight varies between 900 to 1,100 kg).
In our estimates, we assumed that end-of-life vehicles scrapped in 2012 have a variable aluminium content, between 70 to 90 kg per vehicle (with an average vehicle weight scrapped for Italy of 969 kg, source Eurostat). In 2012, the potential for aluminium is therefore 63-81,000 tonnes.
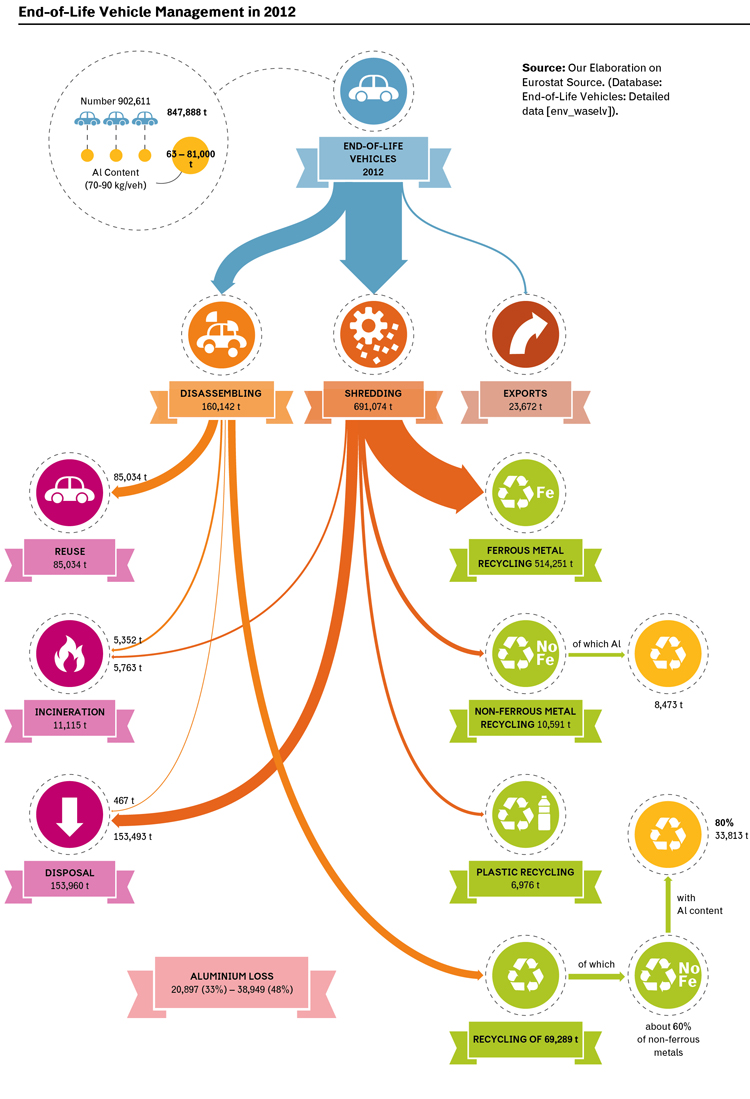
Recovered Aluminium Flow in End-of-Life Motor Vehicles
Eurostat can provide us material recovery data of end-of-life cars.
In 2012, in Italy, over 900,000 cars have been scrapped, with 875,000 tonnes of material. Out of all motor vehicles, after all reuses (85,000 tonnes/year), the recovered material for recycling amounts to 601,000 tonnes, of which 532,000 from shredding and 69,000 from dismantling. In the fraction of recycling from shredding, 10,591 tonnes of non-ferrous metals have been recycled (the remainder being ferrous metals and marginal plastic and rubber flows). As for the recycling fraction from dismantling, no disaggregated data are available for Italy, but from the available?? data for other countries (Germany, Spain, United Kingdom) 61% of non-ferrous metal can be estimated.
Therefore, statistical data calculate the amount of non-ferrous metals sent for recycling. For the estimate of the amount of recovered aluminium we assumed that 80% of non-ferrous materials was made of aluminium. The amount of non-ferrous metals sent for recycling would be around 53,000 tonnes/year and the aluminium alloy fraction 42,000 tonnes, between 52-67% of the potential presence.
Methodology for Quantifying the Aluminium Flow from Motor Vehicles
In an optimized car dismantling system, up to 95% of waste can be recycled; regrettably, in reality, recovery rates are significantly lower.
The Economic Aspect of the Recycling Supply Chain
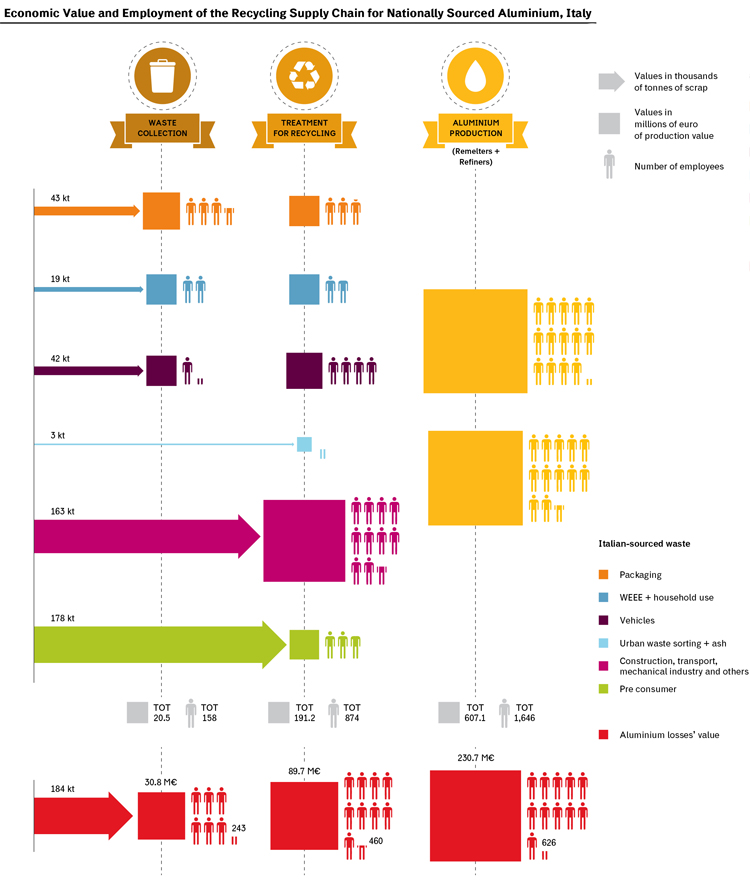
The Economic and Employment Aspect of the Recycling Supply Chain for Italian-Sourced Aluminium
As previously explained, Italy produces only secondary raw aluminium from marketed (pre and post consumer) and businesses’ internal metal scrap, both nationally sourced and imported.
Marketed (i.e. not derived from companies’ internal recovery), nationally sourced metal scrap alone represent roughly one third of production demand, the rest of it being imports and internal metal scrap.
By following the previously explained method, the Italian-sourced recycling supply chain has been estimated, with considerable uncertainties, in its economic and employment aspect.
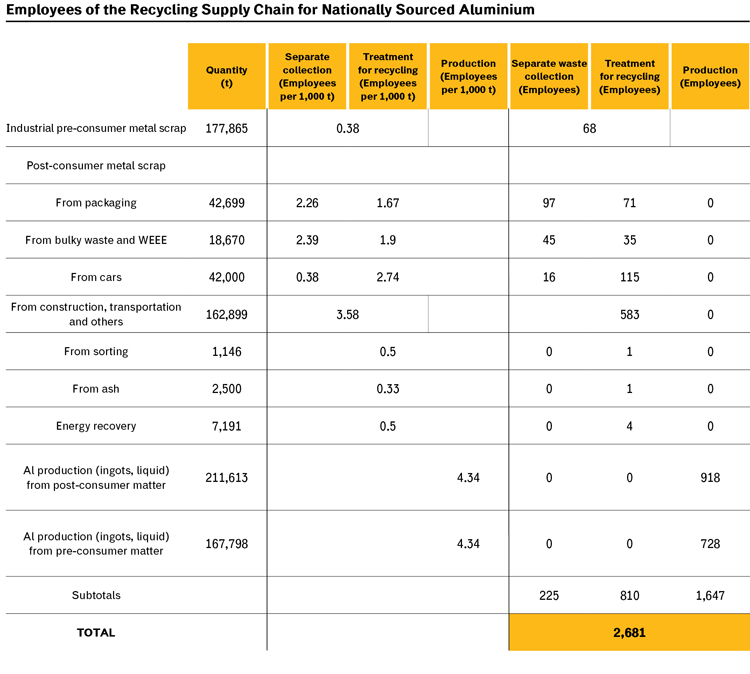
Production value totals little less than €1 billion, about 40% of which comes from collection and treatment for recycling (including metal scrap marketing). Employment totals roughly 2,700 jobs, over 1,000 of which are related to collection and treatment for recycling.
Aluminium “losses” represent a missed value of about €350 million and a loss of 1,350 jobs.
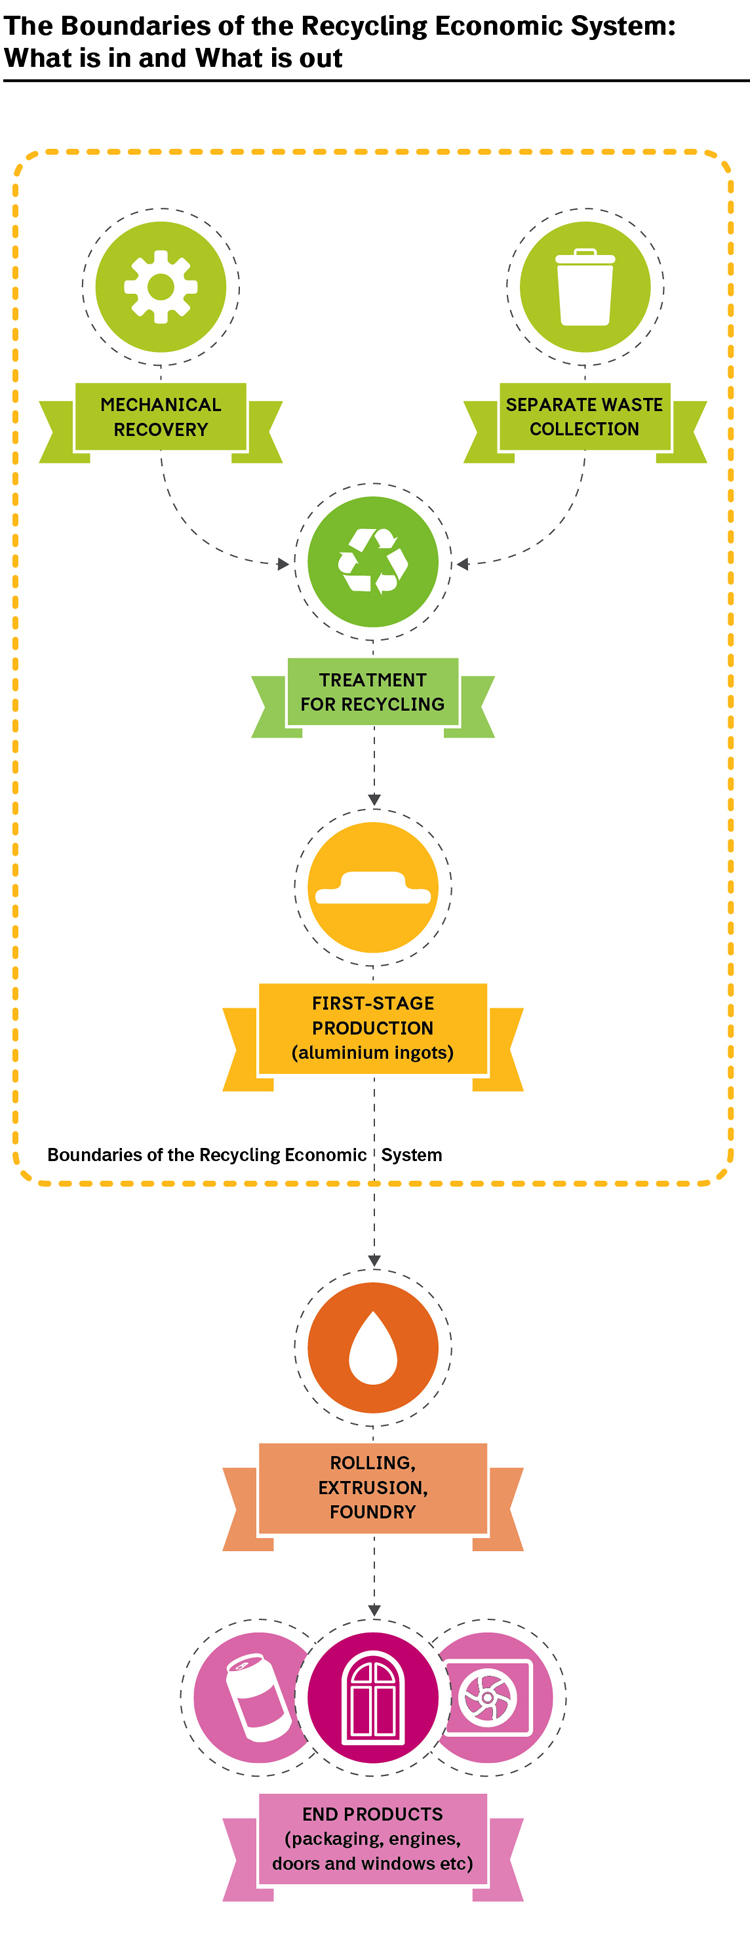
Classification Method of the Recycling Supply Chain: Boundaries
According to the classic definition provided by Beck (2001), the boundaries of the recycling economic system extend to:
1. Activities connected to supply and related to collection and collected materials’ treatment for recycling, i.e. separate waste collection. Treatment for recycling includes activities such as sorting, cleaning, dismantling and/or mechanical and chemical processing (also on residual waste) in order to produce secondary matter meeting the manufacturers’ specifications;
2. Activities connected to demand where recovered materials or used products reach the first section for competing directly with their raw or virgin equivalent, especially with respect to the manufacturing of “first stage” products containing recycled materials. Here, “first stage” refers to the first type of product, which in our case is raw aluminium in slabs, billet and liquid form.
For the record, energy recovery has been included.
Starting from many sources, we have determined, with considerable uncertainties, the production value and employees’ number for each phase.
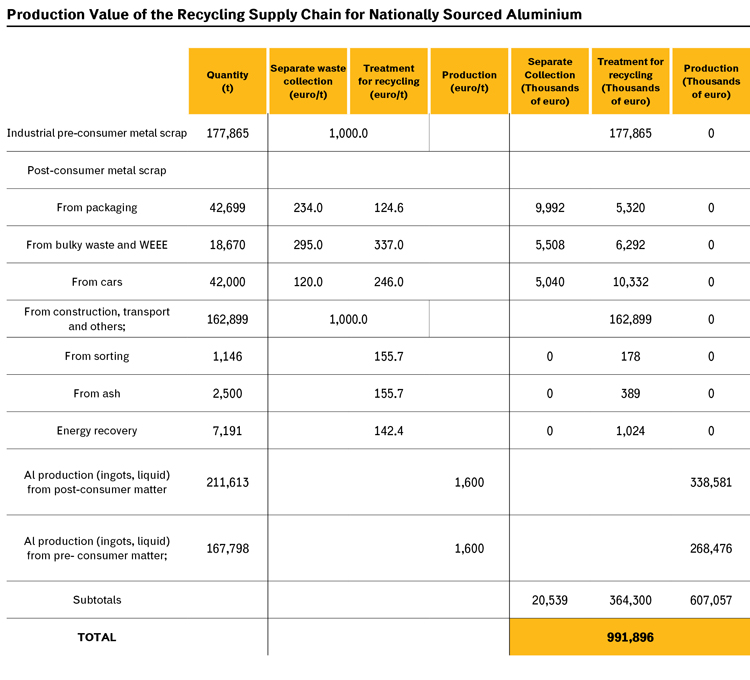
Classification Method of the Recycling Supply Chain: Estimated Production Value
Our estimated production value takes into account:
- The production value of aluminium packaging separate waste collection, calculated on unified service costs for light polymaterial waste collection as found in Bain-Federambiente 2013 (€234/tonne);
- The production value and separate collection of bulky waste and WEEE, based on the average WEEE collection cost established by ISPRA 2014 (Higher Institute for Environmental Protection and Research), i.e. €295/tonne;
- The production value of aluminium packaging treatment for recycling, estimated to be the same as the average sorting and logistic cost of various operations and productions carried out by CiAl (Aluminium Packaging Consortium), namely €124.59/tonne on incoming material. The value equals the average plastic sorting cost of €140/tonne set by Corepla (National Consortium for the Collection, Recycling, and Recovery of Plastic Packaging), considering that aluminium is recovered mainly from the sorting of light polymaterial waste mostly composed of plastic;
- The production value of WEEE and bulky waste treatment for recycling, estimated at €337/tonne, i.e. the average production value of WEEE recovery services. The value is calculated as a ratio between production value and quantity managed by Ecodom, the main Italian consortium for household appliances’ recovery and recycling.
- The production value of end-of-life vehicles’ dismantling and recovery, calculated at €246/tonne, which is the value set by ADEME 2011;
- The production value of energy recovery, which equals the average service cost of €113/tonne (RifiutiLab Benchmark impianti 2012) and is increased by the revenues of energy sale, estimated at 26% of the price;
- The production value of ash recovery, estimated to equal recovered aluminium’s value, i.e. €155.7/tonne, which is conventionally the buying price for CiAl (2013);
- The production value of collection and treatment for recycling of pre-consumer metal scrap and other post-consumer types of waste. Considering both values and using a method similar to ADEME’s, the value has been calculated as equivalent to the average metal scrap sale price (i.e. €1,000/tonne in 2013, which matches the average value of metal scrap destined to export,);
- The production value of industrial recycling processes, calculated at €1,600/tonne based on the value of secondary aluminium sold production (liquid or billet) from ISTAT data 2014 on 2013 production. The secondary aluminium’s quantity from internal metal scrap collection is considered to equal a 94% yield for pre-consumer metal scrap (following remelters’ model) and a 78.4% yield for post-consumer metal scrap (following refiners’ model). Therefore, the whole raw aluminium production from pre and post consumer national collection totals 379,419 tonnes, namely 85% of internal collection (excluding businesses’ internal recoveries).
Classification Method of the Recycling Supply Chain: Employment Estimate
This employment estimate has taken into account direct employment only:
- Operators of aluminium packaging collection services have been calculated by Bain-Federambiente on an average performance at 2.6 employees every 1,000 tonnes for door-to-door and multi-material waste collection (accounting for 76% of aluminium collection) and at 1.2 employees every 1,000 tonnes from on-street collection (which represents 24% of aluminium packaging collection), achieving a total of 2.26 employees every 1,000 tonnes/year;
- Operators of bulky waste and WEEE collection services have been calculated on an average technical performance at 6.25 employees every 1,000 tonnes/year for door-to-door collection (25% of the whole) and at 1.1 employees every 1,000 tonnes/year for delivery to collecting facilities (75% of the whole), achieving a total of 2.39 employees every 1,000 tonnes/year;
- Operators of the pre-consumer (marketed and manufactured) metal scrap collection cycle have been calculated on a technical performance of 0.38 employees every 1,000 tonnes/year (estimate by ADEME 2011 on industrial waste selected collection);
- Operators of services for aluminium packaging treatment for recycling have been calculated on an average technical performance at 1.67 employees every 1,000 tonnes/year (600 tonnes per employee, just like in sorting facilities for light polymaterial waste);
- Operators of services for bulky waste and WEEE treatment for recycling have been estimated on an average technical performance at 1.9 employees every 1,000 tonnes/year (taking into account WEEE sorting facilities);
- Operators of services for used vehicles treatment for recycling have been calculated on an average technical performance at 2.74 employees every 1,000 tonnes/year (estimate by ADEME 2011);
- Operators of services for other post-consumer metal scrap collection and treatment for recycling have been calculated on an average technical performance at 3.58 employees every 1,000 tonnes/year, in compliance with ADEME 2011 estimate on non-ferrous metals;
- As for pre-consumer metal scrap treatment for recycling, zero employment has been estimated;
- Operators of incineration services have been calculated on an average technical performance at 0.5 employees every 1,000 tonnes/year;
- Operators of ash recovery services have been calculated on an average technical performance at 0.33 employees every 1,000 tonnes/year;
- Operators of aluminium manufacture activities have been calculated on an average technical performance at 4.46 employees per 1,000 tonnes of produced raw aluminium (a value obtained from an estimated 5,000 operators of refining and remelting facilities, compared to a raw aluminium production totalling 1,151,000 tonnes).